Specialist in Asia Pacific, Japan, China, India and South East Asia and Global Emerging Market equities.
Discover moreformerly Realindex Investments
Leader in active quantitative equities across Australian equities, global equities, emerging markets and global small companies.
Backed by a unique blend of research, portfolio construction and risk management, focused on uncovering original insights and translating them into investment strategies that are active and systematic, aiming to generate alpha.
Discover moreInvestment strategies
Insights
At Stewart Investors, we believe in putting people first. Our investment world-view is of a series of partnerships – with each other, with our clients, with the companies we invest in, the people who buy their goods and services, and with the wider society in which we all live and work.
Discover more
With default rates on the rise, investors are understandably questioning what to do with their credit investments.
In this note we discuss current default trends, our expectations for default rates going forward, and why we believe investors should remain calm in the near term.
As one might expect, defaults tend to be cyclical in nature with recessions typically pushing the overall default rate higher. The fluctuating US corporate default rate over the past 25 years or so is shown in Figure 1 below.
Figure 1: Long-term US corporate default rates
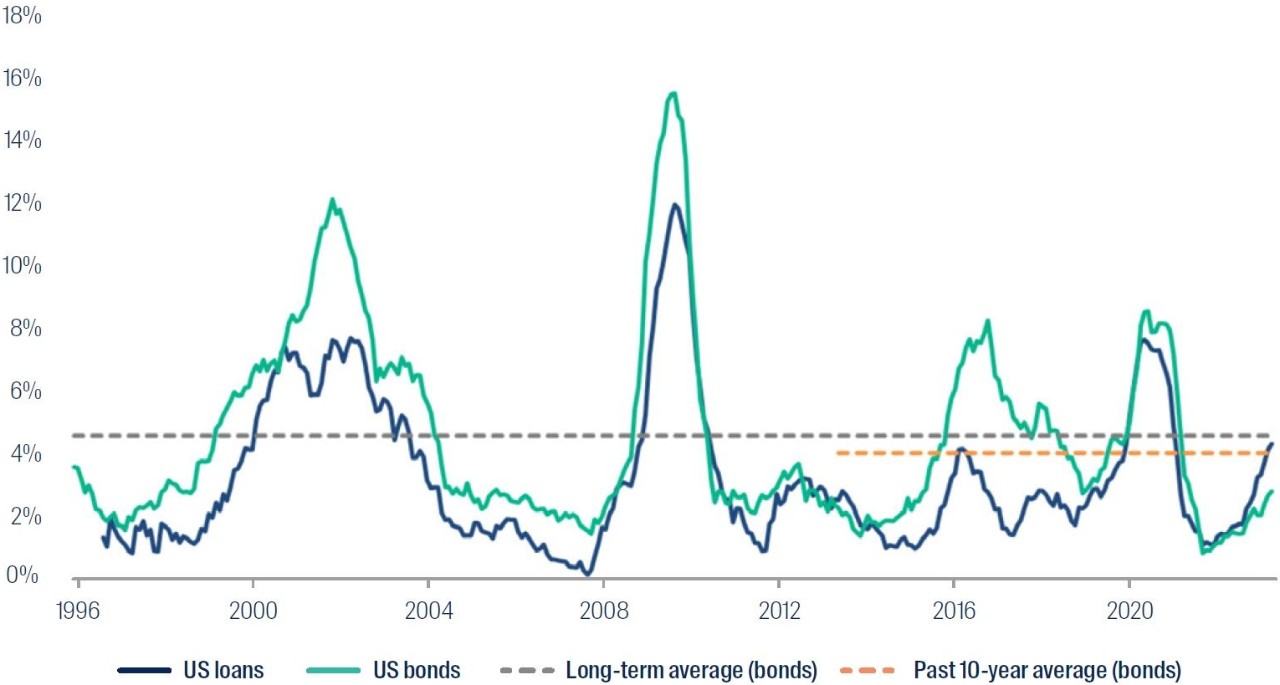
Source: Moody’s Investors Service July 2023 Monthly Default Report, data shown 1 February 1996 to 31 July 2023
We can see that despite increases in defaults in 2016/2017 and 2020/2021, default rates have been below long-term averages in the years since the Global Financial Crisis (GFC). We attribute this to significant central bank stimulus measures over this period, which made funding cheap and accessible for companies.
Interestingly, for the first time in decades we have also seen the corporate default rate for US loans rise above that of comparable US corporate bonds. This is likely due to loans being floating rate in nature; interest costs have increased as the Federal Reserve has raised official interest rates.
Looking forward, with central bank stimulus being removed as authorities battle to control inflation, we believe default rates for corporate bonds are likely to revert back up towards the long-term average. We also expect that they may stay at or slightly above the long-term average for some time.
As Figure 2 shows, this is because companies will gradually adjust to higher all-in funding costs as their existing debt matures. Importantly, however, we are not anticipating an increase to ‘bust cycle’ default rates in the near future.
Figure 2: Maturity profile of corporate bond indices
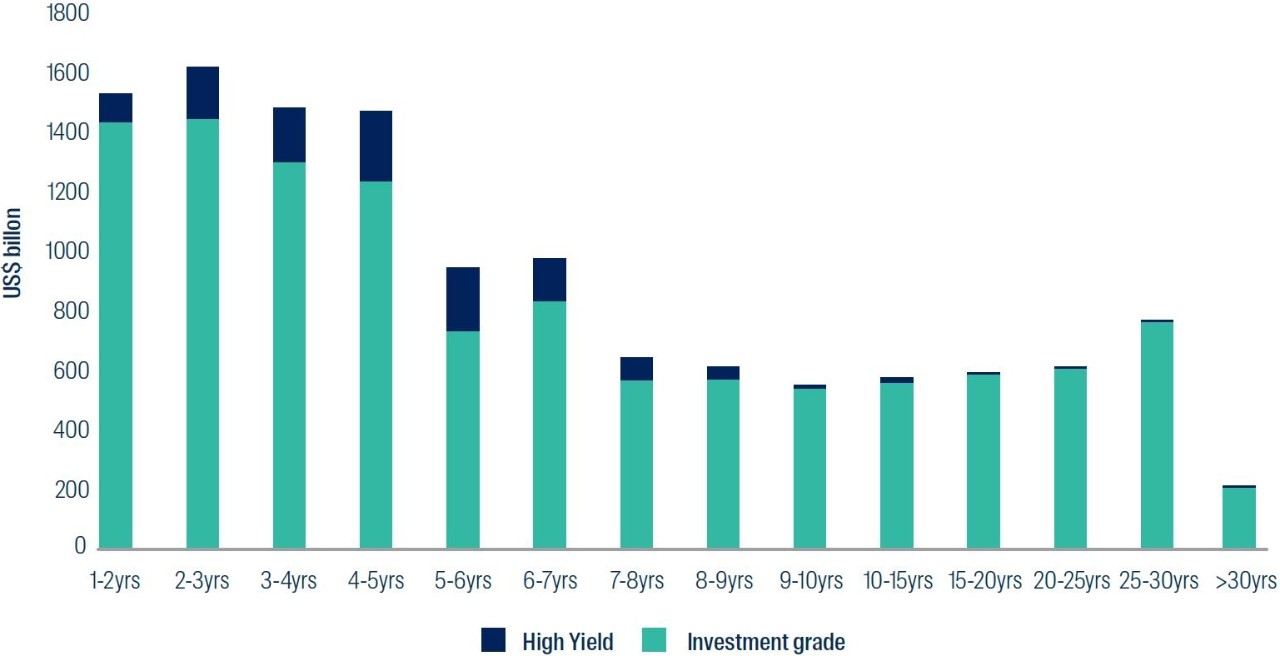
Source: Bloomberg and ICE, as at 31 August 2023. Indices shown are Bloomberg Global Aggregate Corporate Index and ICE BofA US High Yield Constrained Index.
When thinking about the impact of defaults, it is important to consider the actual loss in each case. This requires an understanding of loss given default, otherwise known as the recovery rate received. The recovery rate depends on a number of factors including, but not limited to;
- the level of security attached to the debt obligation owned;
- the amount of debt the company has outstanding;
- where in the capital structure the debt obligation owned sits;
- the type of assets the company has (intangible or tangible); and
- the availability and price of other similar assets, particularly as defaults tend to be driven by thematic events (for example banks during the GFC period in 2008/2009, energy companies in the oil price shock of 2015/2016, firms in the leisure sector following Covid-related shutdowns in 2020, etc).
As highlighted in Figure 3, the recovery rate can vary quite meaningfully depending on these factors, but over the past 25 years or so has typically been somewhere between 30 and 90 cents in the dollar, averaging around 64 cents.
Figure 3: Recovery rates from defaulting companies
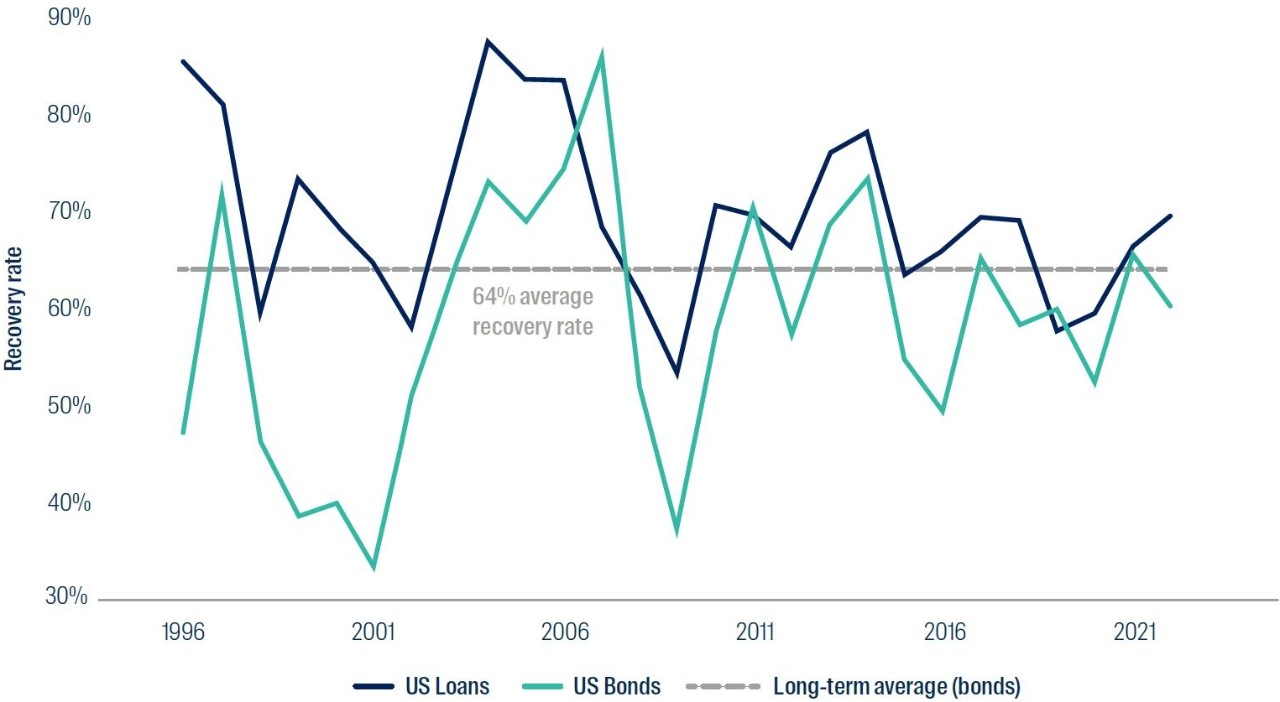
Source: Moody’s Investors Service 2022 Annual Default Study, data shown 1 January 1996 to 31 December 2022
The recovery rates for both loans and bonds will need to be watched closely for signs of deterioration, particularly for loans which have seen a significant structural change over many years in the form of ‘covenant light’ loans, as opposed to loans with strong covenants that can better protect creditors’ interests.
All of this raises an important question; if defaults are increasing and recovery rates potentially falling, should investors have an allocation to credit?
The long-term return profile from the asset class shows us that credit markets generally overcompensate investors for default risk. As we can see in Figure 4, the current excess credit spread – or overcompensation for default risk – available in the sub-investment grade sector is currently below the long-term average, but remains reasonably high and arguably still quite appealing for income-oriented investors.
Figure 4: Excess high yield return after actual losses from default
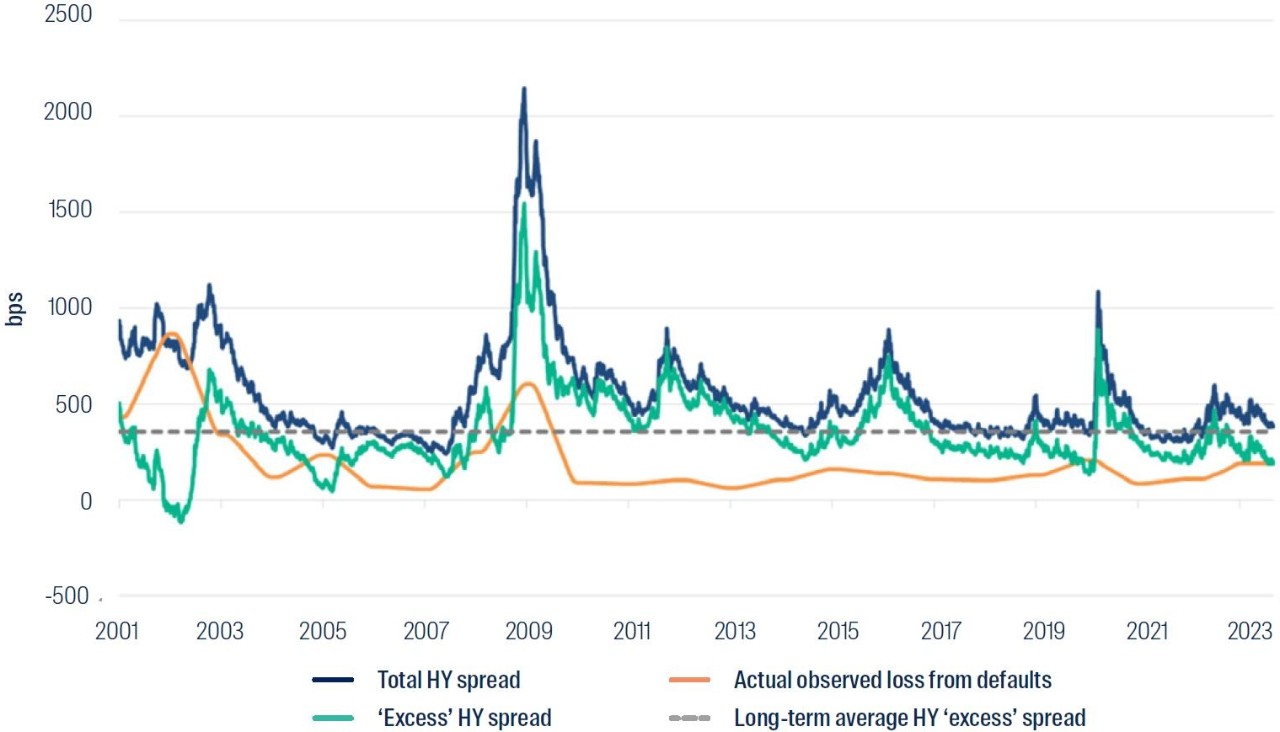
Source: Bloomberg and Moody’s. Data shown 1 January 2001 to 31 August 2023 for the ICE BofA US High Yield Constrained Index.
Defaults are less common in the investment grade sector than the high yield sector, so market practice is to look at current spread levels versus long-term averages. As shown in Figure 5, current credit spreads are currently close to long-term averages and remain healthy in our view. History has also shown us that spreads can stay range bound for long periods of time.
Figure 5: Investment grade credit spreads
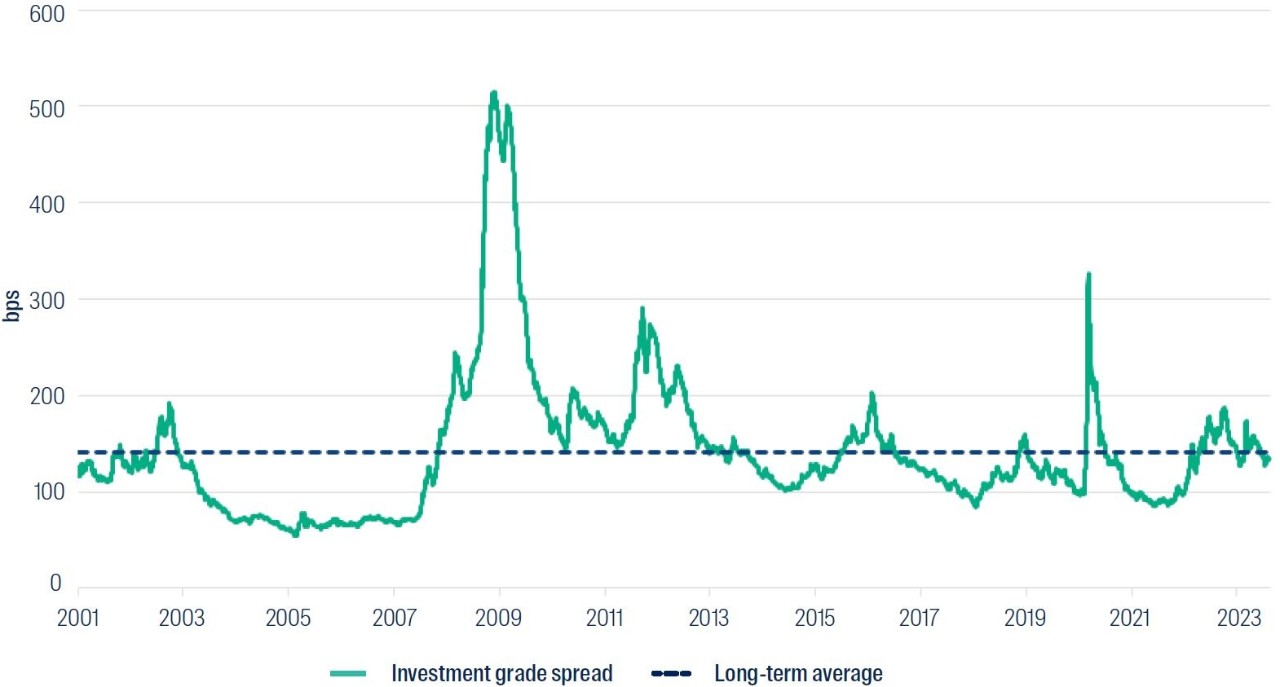
Source: Bloomberg. Data shown 1 January 2001 to 31 August 2023 for the Bloomberg Global Aggregate Corporate Index.
Of course, credit spreads compensate investors for more than default risk; liquidity and volatility are other notable factors. But in broad terms, considering volatility remains subdued and liquidity risks are not heightened, the current level of spreads indicates that investors expect defaults in both the investment grade and high yield sectors to be close to – or slightly below – long-term averages in the period ahead.
Finally it is worth considering break-evens; i.e. the amount of defaults that would be required to wipe out the entire spread return from credit. Using the long-term recovery rate of around 64%, the breakeven default rates for high yield and investment grade markets are currently 10.75% and 3.69%, respectively1. Default rates of this magnitude have historically been associated with deep recessions and are not anticipated in the period ahead.
In conclusion, despite defaults increasing from below long-term averages, credit markets continue to overcompensate investors. This provides income-focused investors with a potentially appealing return profile, in our view.
First Sentier Investors’ Global Credit team are fundamental investors.
We analyse and provide a risk assessment on every bond we invest in. Each risk assessment is also reviewed by a leading member of the team to ensure nothing is missed and the outcome is balanced. The analyst team sits independent to our portfolio management team to ensure an independent assessment of risk. These building blocks have produced a strong track record of avoiding defaults and ensuring appropriate risk taking in portfolios.
1 Calculated using end-August 2023 spread levels for the ICE BofA US High Yield Constrained Index (High Yield) and Bloomberg Global Aggregate Corporate Index (Investment Grade) from Bloomberg (divided by 36%, as 64% is typically recovered); and long-term recovery rates from Moody’s Investor Service.
Disclaimer
This material has been prepared and issued by First Sentier Investors (Australia) IM Ltd (ABN 89 114 194 311, AFSL 289017) (FSI AIM), which forms part of First Sentier Investors, a global asset management business. First Sentier Investors is ultimately owned by Mitsubishi UFJ Financial Group, Inc (MUFG), a global financial group. A copy of the Financial Services Guide for FSI AIM is available from First Sentier Investors on its website.
This material is directed at persons who are ‘wholesale clients’ (as defined under the Corporations Act 2001 (Cth) (Corporations Act)) and has not been prepared for and is not intended for persons who are ‘retail clients’ (as defined under the Corporations Act). This material contains general information only. It is not intended to provide you with financial product advice and does not take into account your objectives, financial situation or needs. Before making an investment decision you should consider, with a financial advisor, whether this information is appropriate in light of your investment needs, objectives and financial situation.
Any opinions expressed in this material are the opinions of the individual author at the time of publication only and are subject to change without notice. Such opinions: (i) are not a recommendation to hold, purchase or sell a particular financial product; (ii) may not include all of the information needed to make an investment decision in relation to such a financial product; and (iii) may substantially differ from other individual authors within First Sentier Investors.
We have taken reasonable care to ensure that this material is accurate, current, and complete and fit for its intended purpose and audience as at the date of publication. No part of this material may be reproduced or transmitted in any form or by any means without the prior written consent of FSI AIM.
Any performance information has been calculated using exit prices after taking into account all ongoing fees and assuming reinvestment of distributions. No allowance has been made for taxation. Past performance is not indicative of future performance.
Copyright © First Sentier Investors, 2023
All rights reserved.
 |  |
|---|