
Realindex Investments explores the key concerns surrounding the Treasury's super reform initiative.
Introduction
As part of the Treasury’s “Your Future, Your Super”1 reform initiative, the Federal Government aims to introduce a number of reforms to the MySuper regime, which accounts for more than $730 bn in Australian retirement saving assets2. One element of these reforms will require APRA to conduct an annual performance test for MySuper products (Annual Performance Test).
While we agree with the spirit of this new initiative, in this note we examine some of our concerns associated with the Annual Performance Test. In particular:
- The impact of asset allocation is largely ignored
- The focus is on relative returns rather than a fund's absolute risk-return profile
- Funds are incentivised to herd together and "hug the index"
- Outperformance is not rewarded, but underperformance is penalised
- Eight years is not enough to assess performance
- It ignores the crucial and emerging issue of ESG
What is the Annual Performance Test?
The proposed amendment to the Superannuation Industry Supervision Act 1993 (SIS Act) will require APRA to conduct Annual Performance Tests for MySuper products each financial year. Trustees of superannuation products that fail the Annual Performance Test must notify members of the failure. Trustees will be prohibited from accepting new members into a superannuation product if the product fails the Annual Performance Test in two consecutive years.
The Annual Performance Test consists of measuring a product to the APRA prescribed benchmark. Products that underperform this benchmark by 50bps per annum over a period of eight years will fail the performance test.3 This test will be applied retrospectively. It is proposed that some discretion may be applied according to the exposure draft explanatory materials4, and thus it is possible for the performance test to be applied to less than eight years’ worth of data. Furthermore, APRA will have the power to assess whether a trustee is deemed to be deliberately creating new products to bypass the performance tests.
The APRA prescribed benchmark is described in the exposure draft explanatory materials to be “an objective, consistently-applied benchmark, giving greater transparency to beneficiaries”. It involves benchmarking individual asset classes within a product to a prescribed set of indices determined by APRA[5]. In calculating the benchmark returns, a product’s historical strategic asset allocation (SAA) asset class weightings are multiplied with the asset class benchmarks to calculate the total product benchmark returns. As a consequence of the target product’s SAA being an input in the calculation of benchmark returns, SAA decisions, whether static or dynamic, are not actually assessed by the Annual Performance Test. Therefore, only manager selection and tactical allocations is at stake here.
Key Concerns
1. Asset allocation drives member outcomes, however the Annual Performance Test does not address inappropriate SAA
Our first concern is that the performance test focuses largely on manager selection within asset classes but not on the asset allocations themselves. This is because the adoption of APRA’s “heatmap” analysis allows the benchmarking to be tailored to a fund’s SAA. The flip side to this flexibility is that SAA is not benchmarked.
Our understanding is that asset allocation deviations from SAA, such as tactical asset allocation (TAA) or dynamic asset allocation (DAA), will therefore be benchmarked. Nevertheless, the majority of total fund risk is derived from SAA, and thus the bulk of a member’s retirement outcomes is generated from this. Furthermore, the benchmarking methodology is not clear on the rules surrounding the differentiation between a change in SAA and a change in TAA (where SAA remains constant): both are changes in asset allocation, but the former is not assessed in the performance test, while the latter is.6
There are many examples which show that in the long run, asset allocation decisions can eclipse manager selection decisions for superannuation funds. For instance, academic research by Ibbotson and Kaplan (2000)7 show that asset allocation can explain up to 90% of the variation in a pension fund’s absolute returns across time and 40% of peer returns.8
We ran some simulations of our own, based on some general asset return assumptions and came to a similar conclusion. Our risk, return and SAA band assumptions are located in the Appendix. We modelled for seven different asset classes (Australian Equities, International Equities, Property, Infrastructure, Credit, Fixed Income and Cash) and assumed manager selection tracking error to be between 1-3%. We also provide a Workbook for those who are interested in conducting robustness tests or changing assumptions. Please note that this Workbook is for illustrative purposes only.
After 10,000 simulations, we found that:
- The majority of a fund's absolute total risk was driven by SAA, in particular from equities.
- In terms of fund tracking error, the contribution from asset allocation was still striking. We saw an approximately 50-60 split between asset allocation and manager selection.
Figure 1. Asset Allocation decisions can dominate a super fund's total risk
In our simulations, SAA dominated 98.5% of total risk and is not assessable under the Annual Performance Test framework. Deviations to SAA were almost symmetric with a mean of zero. This is because, when an SAA deviation moves to underweight (or overweight) equities relative to the SAA, it contributes to decreasing (or increasing) total risk. With asset level tracking errors at 1-3% and the assumption of independence between manager alpha and asset beta, contribution to total risk is very marginal.
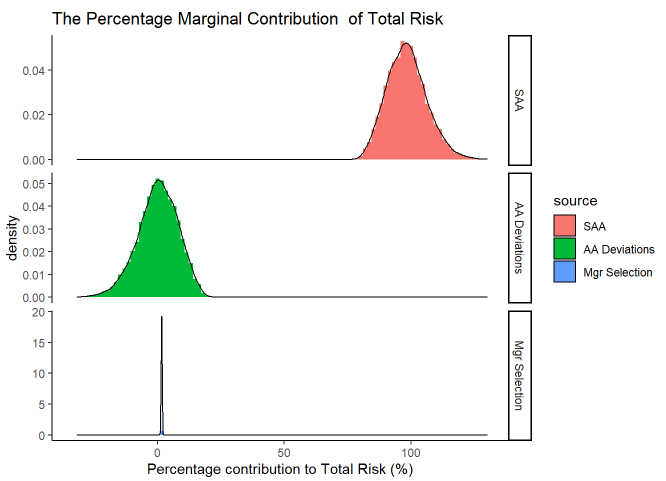
Source: Realindex
Figure 2. A 40-60 split between Asset Allocation and Manager Selection for a super fund's peer risk
We found that both deviations from SAA and manager selection played a role in a fund’s peer risk in our simulations. If a fund holds constant SAA, and attributes all of its deviations as TAA, then both sources are fully reflected in the Annual Performance Test. However, a fund may argue that its asset allocation changes reflect a change to its SAA. If this were the case, not all asset allocation risk will be reflected in the Annual Performance Test.
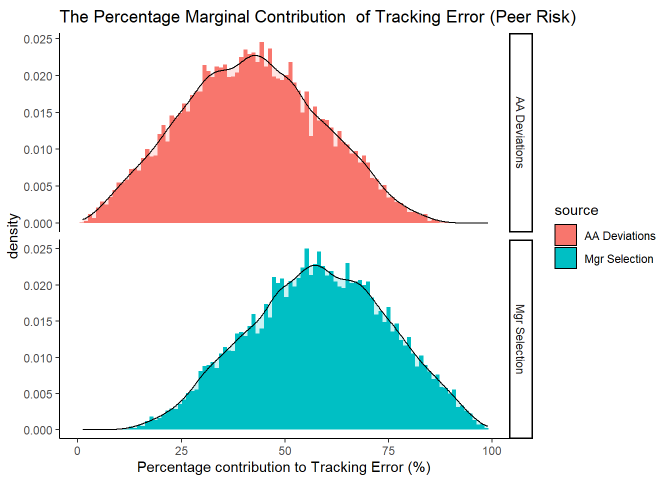
Source: Realindex
We argue that the Annual Performance Test only considers a small fraction of total risk, and potentially not all of peer risk, and therefore is not a comprehensive test of performance.
Below, we show the marginal contribution of total risk and tracking error by asset class from our simulations. On average, our simulated funds had 8.48% total risk and 1.47% tracking error to the SAA benchmarks.
Table 1: Marginal Contributions to Risk
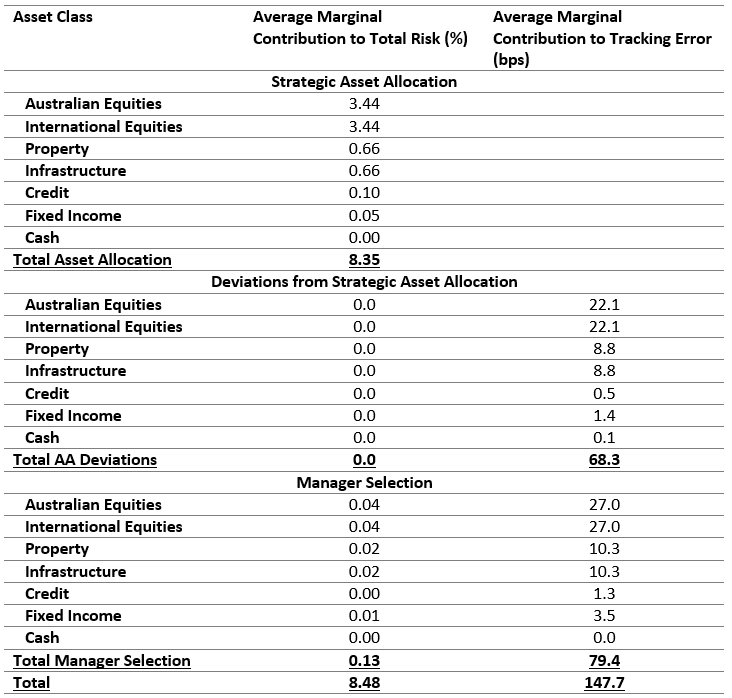
Source: Realindex
Whilst our simulation is relatively simplistic it nevertheless illustrates the importance of good asset allocation in driving member outcomes.
Key Insight #1: We believe asset allocation to be a key differentiator between superior and inferior MySuper products. This dimension of performance is largely ignored in the proposed APRA Annual Performance Tests.
2. Member retirement objectives are absolute, not relative.
Furthermore, we argue that risk-adjusted absolute performance is what really matters for super fund members. In order for superannuation funds to meet their objectives in providing the best possible retirement outcomes, their default plans need to beat inflation by a large and statistically significant margin over the long run. This is very different to beating a weighted combination of market capitalisation indices. For older members, a 10% absolute decline in their super balance is not an acceptable outcome for retirement, despite what their relative performance with respect to market capitalisation is: one cannot eat relative performance, it is absolute returns that matter.
In the simulation below, we examined the probability of a super fund failing a member’s retirement outcomes (based on the same assumptions in the simulation above). Here we define an acceptable member’s retirement outcome is generated from a constant return of CPI + 4% annually. So for instance, a woman earning $100,000 per annum with 2% wage growth and 9.5% super contributions over a period of 20 years should accumulate up to $441,975 for her super as an acceptable benchmark.
We assumed randomised asset allocation that satisfy the fund’s target SAA and SAA bands, and ran three scenarios. 1) “none” – where manager selection alpha is zero, 2) “negative” – where manager selection alpha is -50bps as per the Annual Performance Test’s definition of underperforming and 3) “positive” – where manager selection alpha is + 50bps.
Figure 3 shows that the Annual Performance Test, even if it was 100% accurate in detecting underperforming funds, would have only made a small contribution to improving member outcomes within the simulation. The dispersion of member outcomes due to varied asset allocation was far larger. Choosing asset managers that generated -50bps in mean underperformance increased the chances of failing the CPI +4% benchmark by circa 8%. In the simulations shown later (Figure 5), we find that the Annual Performance Test had an accuracy far less than 100%, which means this 8% contribution is effectively much smaller.
In the extremes, one can consider two funds, one where 100% of its SAA is in defensive assets, and another where 20% of its SAA is in defensive assets. The former can potentially pass its Annual Performance Test with accretive manager selection but is unlikely to provide its members with enough risk to achieve their retirement outcomes. The latter can potentially pick managers who have underperformed their benchmarks and yet still may deliver enough returns to provide for their members. It should be noted at this point that manager selection still accounts for up to 60% of active returns (see Ibbotson and Kaplan, 2000) and is ultimately what distinguishes the active returns of one super fund from another. We are not arguing that manager selection is insignificant, but rather that, the Annual Performance Test seems to miss the impact of SAA, which is the key driving factor of super fund member outcomes.
Figure 3. The Distribution of Member Outcomes with Good, Bad and Neutral Manager Selection Skills
The percentage of outcomes that underperformed the CPI+4% benchmark:
None = 31.6%; Negative = 40.8%; Positive = 23.6%
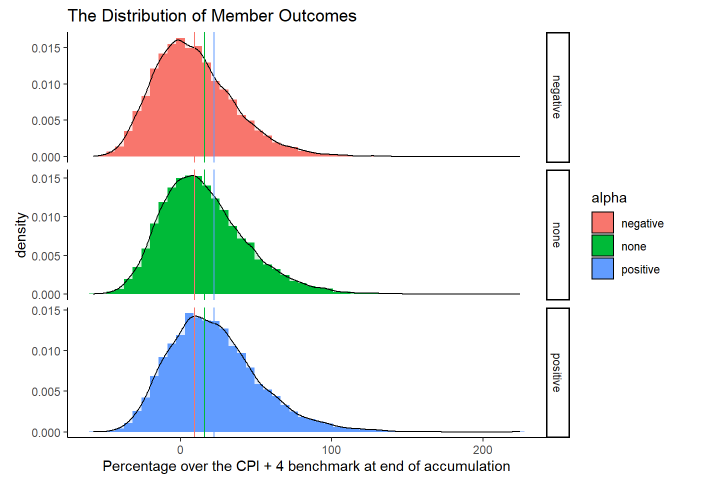
Source: Realindex
Key Insight #2: Solely focusing on relative returns without consideration of asset allocation limits the potential impact to the final outcome for members; absolute risk adjusted returns are what matters in retirement
3. The Annual Performance Test may incentivise "Index Herding"
We argue that, in a bid to reduce the probability of failing the Annual Performance Test, an unintended consequence is for super funds to “hug the index” - to reduce tracking error against the prescribed indices. This creates a scenario where institutional investors may be incentivised to ‘herd’ to a handful of market capitalization indices.
In Figure 4, we show that the probability of failing the Annual Performance Test ramps up significantly when a fund’s tracking error increases. This is a powerful incentive to herd around prescribed benchmarks.
We argue this is not beneficial for members. Whilst the prevailing wisdom may be that the market is “efficient” (i.e. from the well-cited Fama and French literature), we need to remind ourselves of the distinction between the market and the index. Whilst we can debate the efficiency of the market, the index is only a subset of the market, and there’s no academic evidence suggesting it is always efficient. By prescribing MySuper funds with a single set of index benchmarks, one is in effect limiting the investable universe of these funds. Existing academic research shows that there is significant room for market inefficiencies when investors focus entirely on an index (e.g. “the index premium” in Wurgler (2010) and Petajisto (2011)). In short, we argue that when excess capital chases prescribed indices, this creates room for market distortions.
Figure 4. The Probability of Annual Performance Test Failure, subject to Information Ratio and Tracking Error Inputs
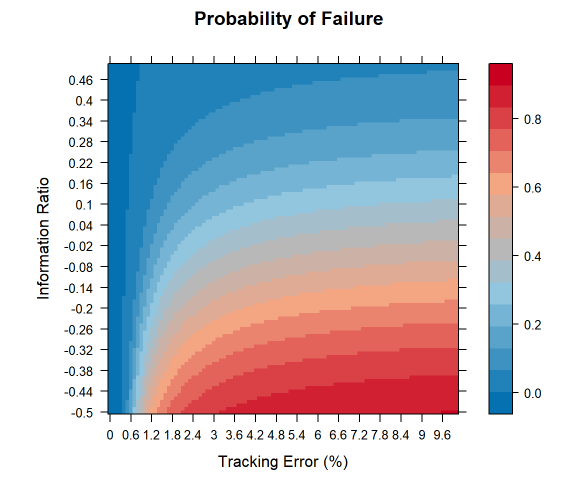
Source: Realindex
Key Insight #3: Incentives drive behaviour. Funds may be incentivised to herd together and “hug the index”.
Furthermore, asymmetric incentives placed upon MySuper funds around performance encourages benchmarking. Outperformance is not rewarded but underperformance is penalised. For argument’s sake, one could create a superfund that invested purely in the prescribed benchmark indices. This fund would avoid penalization, but may not produce the best long term absolute returns and as such may not be in the best interest of member’s retirements.
Key Insight #4: The potential for “Index Herding” is driven by asymmetric incentives – outperformance will not be rewarded, but underperformance will be penalised
It can be further argued that 8 years may not be long enough to determine underperformance. In Figure 5, we simulate a fund with a mean outperformance of 0bps and examine the probability that it is erroneously classified as an underperforming fund under the Annual Performance Test. We show that if the assessment length is short, the probability of “accidental” failure (ie. type II errors) is higher, and thus managers need to reduce their tracking error in order to minimize these errors. At an assessment length of 8 years, the “safe level” of tracking error, whilst subjective and differing from manager to manager, is still very low.
Figure 5. The Probability of Annual Performance Test Failure, subject to Assessment Length and Tracking Error Inputs
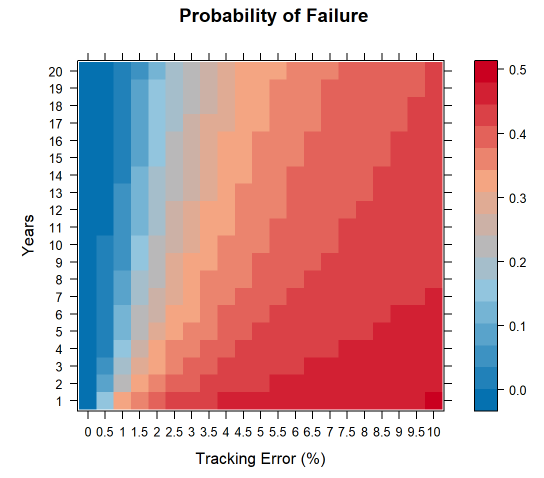
Source: Realindex
Key Insight #5: Eight years is an arbitrary choice of return window and may not capture actual underperformance well.
4. A Narrow Set of Index Benchmarks
The potential problem of index herding is exacerbated by the fact that the APRA asset level benchmarks are narrowly defined.9 For instance, the benchmarks do not differentiate between emerging market and developed market indices, nor is there a small cap versus large cap distinction. More concerning is the lack of an appropriate benchmark for unlisted assets, such as infrastructure and property. In the current proposal, APRA’s performance test will use listed benchmark counterparts.
Whilst some may consider it a natural benchmark, we believe it is a strong assumption to suggest that the market capitalisation index is fit for purpose. The market capitalisation index is one of many indices. Over the past decades, alternative weighting strategies (e.g. smart beta indices) equally-weighted indices, fundamentally-weighted indices, risk-weighted indices, factor-weighted indices and minimum variance portfolios have emerged. In a competitive global funds management environment, these alternative indices have demonstrated absolute risk-adjusted returns that can be competitive to the market capitalisation indices. However, whilst their Sharpe ratios are comparable to market capitalisation, they can run a significantly higher tracking error and are thus significantly disadvantaged within the Annual Performance Test as shown in Figure 4 and Figure 5. However, as shown in sections 1 and 2 of this paper, it is absolute risk-adjusted returns that matter to member retirement outcomes.
Key Insight #6: Proposed set of benchmarks is too narrow and is not representative of available investment opportunities
Moreover, we find a lack of accommodation for ESG considerations in the selection of the APRA asset level benchmarks. ESG considerations, such as stock exclusions, are becoming increasingly important as a way for asset owners to embed the values of their clients. We believe ESG, and more widely governance risk, can be additive to investment performance, rather than tangential. Firms that are actively improving their ESG ratings are more prepared for tomorrow and likely outperform in the long run. These views, however, have long cycles and higher tracking errors. For instance, the vanilla MSCI ACWI ESG Leaders index runs at a 123bps of tracking error to its market cap equivalent. This in turn means that ESG aware superannuation funds are placed at a disadvantage in the Annual Performance Tests as the prescribed benchmarks are no longer appropriate.
More generally, we believe the push to low cost market capitalisation indices reduces the capacity of asset owners and managers to invest in better engagement and stewardship.
Key Insight #7: The proposed benchmarking structure ignores the crucial and emerging issue of ESG, which is a key focus for many investors, both for return-based and values-based outcomes. This is especially concerning for negative screens, which can yield significant tracking error and return deviations from simple benchmarks.
Recommendations and Conclusions
Whilst we welcome reform in the superannuation sector and the identification of underperforming funds, we are concerned that the current set of proposals regarding the Annual Performance Test, in particular the definition of “underperformance” and the methodology for determining it, will not achieve the ultimate objectives of the reforms, i.e. “giving greater transparency to beneficiaries and protecting beneficiaries from underperforming products”.10
Superannuation fund underperformance should be assessed in relation to member retirement outcomes in the absolute risk-return space, rather than peer performance to market capitalisation indices in the relative return space. The Annual Performance Test has little consideration of investment risk. The heavy use of market capitalisation indices in benchmarking overemphasises peer returns at the expense of what really matters to super members, i.e. risk-adjusted absolute performance.
To rectify this, we suggest that the Annual Performance Test needs to incorporate both relative and absolute benchmarks.
- Relative benchmark: as per the current Treasury proposal with APRA proposed asset level benchmarks
- Absolute benchmark: a long-term aggregate fund level benchmark based on CPI, e.g. CPI +4% or a Sharpe ratio test
The absolute benchmark allows for the penalization of poor SAA. Only when a product is underperforming both its long term absolute benchmark and its shorter term peer benchmark, can we then label it as underperforming.
Furthermore, we believe a greater degree of flexibility in benchmarking MySuper funds is required to allow for various investment styles that is currently not represented, such as smart beta, ESG and unlisted assets.
1On the 26th of November 2020, the Treasury released the exposure draft of the “Your Future, Your Super” package.
2The Australian superannuation system currently manages $2.9 trillion of retirement savings of which more than $754 bn are in MySuper funds. ASFA, December 2020, www.superannuation.asn.au/ArticleDocuments/269/SuperStats-Dec2020.pdf
3Your Future, Your Super, Federal Government, October 2020, page 24 available at: https://treasury.gov.au/sites/default/files/2020-10/p2020-super_0.pdf
4https://treasury.gov.au/consultation/c2020-124304
5Appendix 2 in Your Future, Your Super pamphlet lists out the benchmarks proposed by APRA. Source: https://treasury.gov.au/sites/default/files/2020-10/p2020-super_0.pdf
6In our simulations, we assume SAA remains constant, and any deviations from SAA is assessable TAA. However, it is possible that a portion of this TAA can be reclassified as a change to SAA by the fund, and thus not assessable in the performance test.
7Ibbotson and Kaplan (2000) paper can be found in the CFA Institute journal: https://www.cfainstitute.org/research/financial-analysts-journal/2000/does-asset-allocation-policy-explain-40-90-or-100-percent-of-performance
8Manager selection remains important, and accounts for 60% of active risk. From a super fund perspective, manager selection plays an integral role in distinguishing them from their peers. Nevertheless, from a member perspective, the majority of investment risk is decided by a fund’s SAA.
9Appendix 2 in Your Future, Your Super pamphlet lists out the benchmarks proposed by APRA. Source: https://treasury.gov.au/sites/default/files/2020-10/p2020-super_0.pdf
10Exposure Draft Explanatory Materials – Treasury Laws Amendment (Measures for a Later Sitting) Bill 2020: Addressing Underperformance in Superannuation, paragraph 1.1, available at: https://treasury.gov.au/sites/default/files/2020-11/c2020-124304_underperformance_em.pdf
Appendix
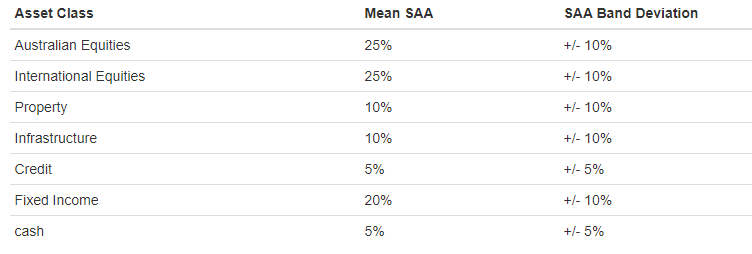
We impose some general assumptions on the asset allocation bands of a balanced fund (default MySuper option). We have used 7 asset classes, and for simplicity without a loss of generality, we have ignored sector tilts such as broad caps vs small caps or developed vs. emerging markets. This is also consistent with APRA’s benchmarking, which does not distinguish for small caps or emerging markets.
Table 1 shows our mean SAA assumptions for the 7 asset classes and our asset allocation band deviation assumptions. Asset allocation deviations can be due to changes to a fund’s SAA or shorter term TAA / DAA positioning. In these simulations, we don’t make further assumptions for distinguishing between the two with AA deviations. That is, we assume fund risk comes from three sources: i) SAA, ii) AA deviations and iii) manager selection. However, we note that AA deviations due to changes in long term SAA will be incorporated in the APRA benchmarks, and thus not assessed for under-performance, but shorter term TAA will be assessed.
Table 1. Balanced Plan SAA and SAA Bands
We make some long-term mean variance assumptions. These assumptions are based on long term views of growth assets, mid-risk assets and defensive assets.
Table 2. Asset class mean-variance assumptions
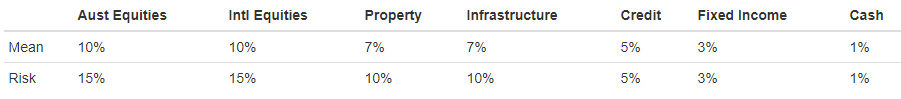
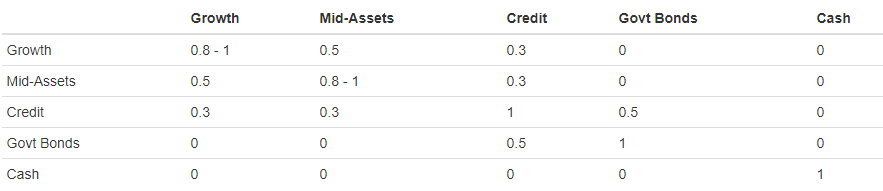
Table 3. Asset class correlation matrix
We have simplified asset class correlations into the following five categories.
- Growth assets: Equities
- Mid assets: Property and infrastructure
- Credit
- Govt Bonds (FI)
- Cash
We assume asset classes with categories, such as Australian vs International Equities, have a correlation of 0.8.
Furthermore, we have made some assumptions on manager selection tracking error. We have assumed no correlation between manager alpha and asset class beta, i.e. alpha is orthogonal to beta. We have assumed a small level of correlation between cross-asset manager alpha, between say Australian Equities and International Equities.
Table 4. Manager Tracking Error Assumptions

References
Ibbotson R.G. and P.D. Kaplan (2000) Does Asset Allocation policy explain 40, 90 or 100 percent of performance?, Financial Analyst Journal
Petajisto, A. (2011) The index premium and its hidden cost for index funds, Journal of Empirical Finance
Wurgler, J. (2010) On the Economic Consequences of Index-Linked Investing, National Bureau of Economic Research
Important information
This material has been prepared and issued by First Sentier Investors (Australia) IM Ltd (ABN 89 114 194 311, AFSL 289017) (Author). The Author is a related body corporate of First Sentier Investors Realindex Pty Ltd (ABN 24 133 312 017, AFSL 335381) (Realindex). Both the Author and Realindex form part of First Sentier Investors, a global asset management business. First Sentier Investors is ultimately owned by Mitsubishi UFJ Financial Group, Inc (MUFG), a global financial group. A copy of the Financial Services Guide for the Author is available from First Sentier Investors on its website.
This material contains general information only. It is not intended to provide you with financial product advice and does not take into account your objectives, financial situation or needs. Before making an investment decision you should consider, with a financial advisor, whether this information is appropriate in light of your investment needs, objectives and financial situation. Any opinions expressed in this material are the opinions of the Author only and are subject to change without notice. Such opinions are not a recommendation to hold, purchase or sell a particular financial product and may not include all of the information needed to make an investment decision in relation to such a financial product.
To the extent permitted by law, no liability is accepted by MUFG, the Author, Realindex nor their affiliates for any loss or damage as a result of any reliance on this material. This material contains, or is based upon, information that the Author believes to be accurate and reliable, however neither the Author, MUFG, Realindex nor their respective affiliates offer any warranty that it contains no factual errors. No part of this material may be reproduced or transmitted in any form or by any means without the prior written consent of the Author.
Copyright © First Sentier Investors (Australia) Services Pty Limited 2021
All rights reserved.
