
The idea
We pose the question – what if we could develop a way of predicting which companies are more likely to be suffering distress, and which were not? The idea contains three parts:
A. Certain individual observations or metrics can separately tell us about stocks that might – in the near future – find themselves in trouble.
B. If we combine enough of these metrics together – without overfitting – we can get synergy between the factors.
C. If we build a smart model that is designed specifically to target corporate distress, then we can apply and refine the predictions from the metrics in a better way.
There will be many ways to capture the idea of corporate distress – we include a brief section below on several of these strands of research. The approach we have used directly targets predicting the “event” of corporate distress – that is, when a firm, at some time in the future, has a “red flag” raised against it. Other methods might include finding a model that maximises the gap between good and bad firms, or even apply sophisticated machine learning techniques to pick characteristics of firms which are destined to be in trouble.
We also have to think about what we mean when we say a company is in distress. Previous publications from Realindex have used other measures like interest cover to categorise firms as zombies, for example1. In this process at hand we use a different approach – we use a well-known model of “distance to default” from academia that has found extensive use in practice. This yields a full spectrum of default predictions – from highly likely to highly unlikely. Our approach is to treat the distress “event” as appearance in the left tail of the distribution 12 months into the future – that is, firms that will be ranked worst by this measure in 12 months’ time are categorised as “in distress”.
Finally, we carefully choose the estimation method of distress using a probability-based model. The model aims to predict the probability of corporate distress by classifying each stock as “in distress” (value = 1) or not (value = 0). This method is known as a logit model (alternatively as a logistic regression). We discuss this in more detail below.
One innovation in this research is to use one well-known approach to forecasting default or corporate distress to predict a second type of forecast. The first approach uses accounting and market variables, while the second type of forecast uses an option pricing model.
In summary:
- We combine a set of reported accounting variables for each firm, and the trends in those variables (intentionally, none of these variables is a forecast), with a set of well-known stock level market variables.
- We define the term “corporate distress” as the left tail of a forecasting model of distance to default.
- We build and estimate a prediction model based on the probability of distress.
Within Realindex investment processes, there are two potential direct applications of this idea at the moment which we are exploring. Firstly, we see this as a risk measurement and reporting tool, and as a universe screening mechanism. Stocks which appear to be trending towards corporate distress are flagged and their exposure within the portfolio is captured. The second application is to create a “future value trap” alpha model, where the portfolio can aim to rotate away from these firms. As this is a longer term factor, its alpha contribution in the medium term is likely to be positive but small.
Historical work
There have been many attempts through time to predict corporate distress or default/bankruptcy. Most are used in some form of credit scoring or credit risk assessment. The most well-known is the Altman Z-score model from 1968 (and the extended version Altman Z-score Plus from 2012) which uses a discriminant function to maximise the ability to distinguish between two groups of stocks – those that default and those that do not. Altman’s model2 is simple:
Altman Z-Score = 1.2A + 1.4B + 3.3C + 0.6D + 1.0E
Where:
A = working capital / total assets
B = retained earnings / total assets
C = earnings before interest and tax / total assets
D = market value of equity / total liabilities
E = sales / total assets
If the Z-score is < 1.8 then it is highly likely to be classed in the default group, while if it is > 3 it is highly likely to be classed in the unlikely-to-default group. Between these values, the prediction is not clear.
This model is simple and easy to use but leaves a lot to question – for example, what is the likelihood of default? Or, how do you classify firms with Z-scores between 1.8 and 3?
The second method of examining default or measuring credit score stems from the option pricing research of Merton (1974). [See next section for a detailed breakdown of this idea.] It bases its predictions on the idea that equity and debt are linked by option pricing – equity can be viewed as a call option written by debt holders on the value of assets in the firm.
Apart from value and maturity of debt, leverage and asset price volatility, no other variables are used. It relies on the option structure for its predictions.
Campbell, Hilscher and Szilagyi (2011)3 build the model in a different and intuitive way. They estimate what is known as a logit model (or logistic regression) which estimates the probability of an observation belonging to one of two classes: e.g., distressed firms or non-distressed firms. The underlying assumption is that the cumulative probability of distress follows what is known as a “logistic function”. The next sections go into this in more detail as it is the key model we use here.
The result is a set of explanatory variables that help to explain the probability of default, measured in this way. Campbell et al (2011) uses mostly accounting variables and US only data; we augment this with more market variables and a wider universe.
A third set of models is associated with the more general idea of proportional hazard models (Cox (1972)4, which are a statistical way of measuring how external (explanatory) variables affect the underlying evolution of risks like default. These are interesting but too complex to deal with here at the moment.
The most recent developments in this area are application of more advanced techniques in the machine learning field. Older techniques in this space include discriminant analysis and logistic regression (as above) but there are many others: decision trees and random forests, support vector machines, and neural networks. See review papers like Kim, Cho and Ryu (2020)5 for details.
Why predicting corporate distress is better than bankruptcy
Much of the historical work is aimed at predicting known defaults – in particular, Chapter 11 filings in the US. Firms which file for protection under Chapter 11 are declaring that an external administrator and (usually) recapitalisation are required for the firm to continue. Each country around the world has different legal structures which can resemble US Chapter 11, although the process of administration and even trading following this event can be very different. Further, in listed equity funds like those run by Realindex, we want to capture the forecast of distress in a meaningful way. This might be done through a screening or exclusion process, through a stock factor model exposure or through a portfolio construction constraint. If we are predicting bankruptcy (e.g., via Chapter 11) in a real sense we have tried to “close the gate after the horse has bolted”.
A better approach is to predict the corporate distress that usually precedes default. For this reason, we try to build a model which captures this distress (and perhaps the slide to default) well in advance of the bankruptcy event itself. For this we look to a well-known academic model by Merton (1974), which captures the distance a firm is from default. These “distance-to-default” models have found extensive use in the markets, most notably with the Moody’s-KMV model6.
Using the Merton idea and the Distress Classifier
In 1973, a famous academic paper7 was published by Black and Scholes, one which transformed thinking on the valuation of options and led to many other very productive areas of research. Working alongside Fischer Black and Myron Scholes was a fellow academic named Robert C. Merton (his father, Robert K. Merton, was a famous economist). The following year, Merton published a paper8 which used the Black-Scholes option pricing model in a corporate setting. That is, he realised that equity in a firm can be thought of as a call option on the assets of a firm, written by the debt holders. By doing this, he was able to build a model which yielded:
- The credit risk of a firm
- The distance a firm might be from default.
This “distance to default” idea makes a number of assumptions that may be unrealistic, but provides a structure which can be applied in practice. The graphic below helps to depict this model.

A number of papers following this attempted to simplify its application. Out of these, the two that we have looked at closely are the “Spreadsheet Merton” model of Bystrom (2003)9 and the “Naïve Merton” model of Bharath and Shumway (2008)10 (which extends on the paper by Crosbie and Bohn (2003)11).


The “naive DD” formula is our application of Merton’s model. We use a combination of this raw Naïve Merton score and its short term trend in construction of our Distress Classifier. Steps are:
Combine Naive Merton and its trend in a weighted average at time T
Calculate the Z-score
Distress Classifier = 1 when Z-score ≤ -1.5 (i.e., left tail of the Z-score)
= 0 when Z-score > -1.5
Model and data
What is our logit model? It is a model that estimates how well a set of explanatory variables predicts membership of one of two groups:
In distress Merton Z-score ≤ -1.5 --> Distress Classifier (Dependent Variable) = 1
Not in distress Merton Z-score > -1.5 --> Distress Classifier (Dependent Variable) = 0
The explanatory or independent variables are a group of accounting and market variables - see the table below. The model itself takes the form below (from the Campbell et al (2011) paper) where P(.) is the probability of the distress event:

The table below lists the explanatory variables we use. We also give the summary statistics for both the full sample and for the “failure group” – those that have a Distress Classifier equal to 1. The data set we use here is MSCI ACWI. (Results for just the Australian ASX200 universe are in the Appendix.)12
For each month in our data set (Dec 1998 to May 2021) we collect the variables in the table, and then classify them as “Failure Group” if the Distress Classifier = 1 in 12 months’ time.

Source: Factset, Realindex, data as at 31 May 2021.
Notable differences include in beta, book yield, ROA, asset turnover and 12 month momentum.
We can also see that the percentage of firms in the sample that are in the failure group is at around 6% throughout the sample. This is a function of our “left tail of Z-score” process and does not of course say that 6% of firms are likely to fail each year.

Source: Factset, Realindex, data as at 31 December 2020.

Source: Factset, Realindex, data as at 31 December 2020.
Results
We run the model across the entire sample, where for each month we are attempting to predict the Distress Classifier 12 months ahead. In-sample fit is in the Table below.
We see that increased probability of distress is driven by (among other things) increasing beta, book yield, leverage, earnings uncertainty, asset growth and short term momentum, and decreasing ROA, long term momentum and liquidity (quick ratio).
Some results are somewhat counterintuitive - increased probability of distress is related to increased asset turnover and short term momentum, for example. (It could be argued that a positive correlation with asset turnover might imply a large asset sell-off in advance of declining growth - which will artificially inflate the ratio.)
We then repeat the estimation using a rolling window and example how well the model performs out of sample. The conclusion is that the model seems to have good performance in its ability to select “distressed” firms out of sample as well. Pseudo R squared out of sample is in the following chart13.

Source: Factset, Realindex, data as at 31 May 2021.

Source: Factset, Realindex, data as at 31 May 2021.
To show how well the fitted model works as a stock return predictor, we then collect predicted values of the model and divide them into deciles. The one month ahead returns are plotted below: we can clearly see that the greater the predicted probability of distress, the lower the expected return. Note that this is not the return from the Distress Classifier – it is the return from the fitted model 12 months before the distress “event”.

Source: Factset, Realindex, data as at 31 May 2021.
Some examples
It would be remiss of us to conclude without giving some concrete stock level examples of how this all works.
An important note: firms that are in distress may underperform their peers, however there is no guarantee they will default. Far from it – many firms rebound and thrive. On the other hand, many firms which become bankrupt, default or enter administration, do so for reasons which are difficult to anticipate – for example fraud, or external events.
Three examples (all are Canadian but only by coincidence):
- Nortel Networks was a Canadian telecommunications firm that filed for bankruptcy protection in January 2009 following the global economic downturn in the wake of the GFC. It ended this period of bankruptcy in 2017 after a payment to creditors14.
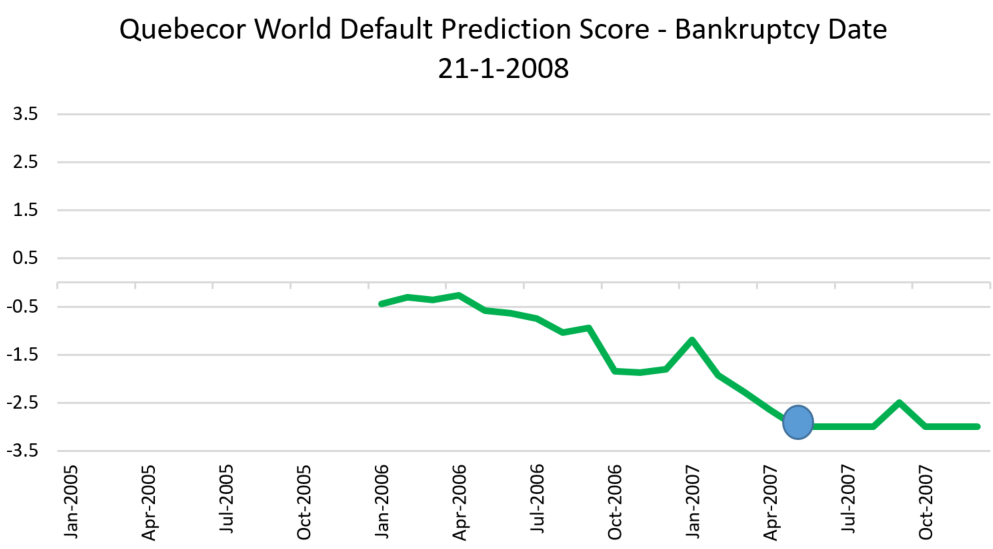
- Quebecor World Inc was a Canadian based printing and media firm, filed for bankruptcy in January 2008 due to excessive leverage and it emerged from bankruptcy proceedings in 2009 following an internal restructure15.
- Sino-Forest was a Chinese forestry company listed in Canada that filed for bankruptcy in 2016 after it was accused of “inflating its revenues and exaggerating the value of its timber holdings”16 which it vigorously denied.
The table below gives the data from our model that went into predicting probability of default for these firms 12 months before the bankruptcy date for each stock. Using this data, a composite forecast is calculated. This is the forecast of probability of default in 12 months’ time – i.e., the forecast for (what later turned out to be) the actual bankruptcy date.
The data are not raw values – for comparison over time and between stocks, each variable is Z-scored. This means that an average value is zero, a very high value is +3 and a very low value is -3.
The charts below the table show the evolution of the forecast over time, and the blue dots represents the 12-month ahead forecast exactly 12 months before the firms actually went bankrupt. These dots correspond to the last row of the table.

Source: Factset, Realindex, data as at various dates in table.


Source: Factset, Realindex, data as at various dates in table.
The first two firms show a gradual degradation of the predicted default probability – both were predicted to be a very high chance of distress (which turned out to be true). Nortel had recovered a little prior to its actual default, but both were below the -1.5 score and so would have been flagged as high risk.
As a counter example, we have chosen Sino-Forest, which is quite different. Its predicted probability of default is quite low (Z-score > 0) so would not have been flagged as high risk. It must be said that the driver of its bankruptcy is quite different to the other two firms.
Conclusions and how we might use this at Realindex
We have used a well-known model of firm distress, and tried to predict it 12 months in advance using a variety of accounting and market variables. The results show that we can categorise “distressed firms” fairly well, and that there appears to be alpha in getting early negative exposure to firms with increased probability of distress. Data is MSCI ACWI – we find less convincing results in Australia; the results are in the Appendix below.
As noted in the introduction, we believe there are two direct applications of this idea. The first is to highlight stocks which appear to be trending towards corporate distress to portfolio managers and researchers alike. The second application is to create a “future value trap” alpha model, where the portfolio can aim to rotate away from these firms.
Appendix: Australian Results
Results here are not as compelling as globally. Pseudo R squared is less and the alpha profile is not monotonic – that is, the highest quintile of predicted distress yields a return equivalent (more or less) to the lowest quintile. This apparent non-linearity may be sector or data specific.
In any case, the application of this model in broad cap Australian equities does not seem to hold.
Interestingly, it seems to hold strongly in Australian small caps.


Source: Factset, Realindex, data as at 31 December 2020.
References
[1] https://www.firstsentierinvestors.com.au/au/en/institutional/insights/latest-insights/covid-credit-zombies.html
[2] Altman, Edward I. (September 1968). "Financial Ratios, Discriminant Analysis and the Prediction of Corporate Bankruptcy". Journal of Finance. 23 (4): 189–209
[3] Campbell JY, J Hilscher and J Szilagyi (2011). “Predicting financial distress and the performance of distressed stocks”. Journal of Investment Management 9(2): 14-34.
[4] Cox, David R (1972). "Regression Models and Life-Tables". Journal of the Royal Statistical Society, Series B. 34 (2): 187–220
[5] Kim H, H Cho and D Ryu (2020), Sustainability Vol 12: Corporate Default Predictions Using Machine Learning: Literature Review
[6] https://www.moodysanalytics.com/about-us/history/kmv-history
[7] Black, Fischer; Scholes, Myron (1973). "The Pricing of Options and Corporate Liabilities". Journal of Political Economy. 81 (3): 637–654
[8] Merton RC. 1974. On the pricing of corporate debt: the risk structure of interest rates. J. Finance 29:449–70
[9] Bystrom (2003), UTS working paper, “Merton for dummies: a flexible way of modelling default risk”
[10] Sreedhar T. Bharath, Tyler Shumway, Forecasting Default with the Merton Distance to Default Model, The Review of Financial Studies, Volume 21, Issue 3, May 2008, Pages 1339–1369,
[11] Crosbie and Bohn (2003) is a white paper published by KMV (now Moody’s-KMV) entitled “Modelling Default Risk”
[12] We exclude Financials (GICS40) as the measures used in the Distress Classifier do not apply well to that sector
[13] Pseudo R squared is the logit model equivalent to normal regression R squared
[14] https://www.reuters.com/article/us-nortelnetworks-bankruptcy-idUSKBN1582TO
[15] https://www.reuters.com/article/cbusiness-us-quebecor-plan-idCATRE55T72120090701
Important Information
This material has been prepared and issued by First Sentier Investors Realindex Pty Ltd (ABN 24 133 312 017, AFSL 335381) (Realindex), which forms part of First Sentier Investors, a global asset management business. First Sentier Investors is ultimately owned by Mitsubishi UFJ Financial Group, Inc. (MUFG), a global financial group.
This material is directed at persons who are ‘wholesale clients’ (as defined under the Corporations Act 2001 (Cth) (Corporations Act)) and has not been prepared for and is not intended for persons who are ‘retail clients’ (as defined under the Corporations Act). This material contains general information only. It is not intended to provide you with financial product advice and does not take into account your objectives, financial situation or needs. Before making an investment decision you should consider, with a financial advisor, whether this information is appropriate in light of your investment needs, objectives and financial situation.
Any opinions expressed in this material are the opinions of the individual author at the time of publication only and are subject to change without notice. Such opinions: (i) are not a recommendation to hold, purchase or sell a particular financial product; (ii) may not include all of the information needed to make an investment decision in relation to such a financial product; and (iii) may substantially differ from other individual authors within First Sentier Investors.
To the extent permitted by law, no liability is accepted by MUFG, Realindex nor their affiliates for any loss or damage as a result of any reliance on this material. This material contains, or is based upon, information that Realindex believes to be accurate and reliable, however neither MUFG, Realindex nor their respective affiliates offer any warranty that it contains no factual errors. No part of this material may be reproduced or transmitted in any form or by any means without the prior written consent of Realindex.
Any performance information is gross performance and does not take into account any ongoing fees. No allowance has been made for taxation. Past performance is not indicative of future performance.
Copyright © First Sentier Investors, 2021
All rights reserved.
