
Like the Jabberwock1, alpha is hard to find. Consistent positive alpha is elusive, yet it remains the core objective of active management. Active managers continuously strive to capture it, and asset owners depend on managers who succeed in doing so effectively.
Sources of alpha can be categorised as coming from:
- Limits to arbitrage – when a profitable opportunity is too expensive to find or to exploit.
- Information complexity – information flow is so fast and has such high volume that it is difficult to keep up with it.
- Behavioural biases – persistent and seemingly irrational human behaviour that pushes prices away from fair and accurate value.
- Risk premia – by taking on a risk we expect a reward.
RQI (and quantitative equity managers in general) aim to capture alpha streams from these sources in many ways, while at the same time understanding the risks taken and attributing realised returns to input sources of ideas. But how do we capture them most efficiently?
Before we move away from this, here is an important point. Sources of alpha (“signals” or “models” as we call them) are usually two sided. That is, signals forecast stocks that we expect to outperform and others we expect to underperform. To properly exploit our insights and generate consistent alpha, we need to capture both sides of our signals.
Hold that thought for now.
Problems with Long Only
We now must ask this obvious question - how do we build a portfolio that best captures consistent alpha, with as little signal degradation2 as possible, and at the same time minimises uncompensated risk? That is, how do we maximise what we call information ratio (IR) – the ratio of expected active return to active risk?3
The usual approach to portfolio construction is just to buy stocks tilting towards our signal forecasts and taking small positions versus the benchmark.
The more our signals and models like a stock, the more we will buy. At the same time, to control active risk we keep our weights within a tight range of the benchmark.
We call this type of portfolio Long Only as it only buys stocks (goes long). In building these portfolios we aim to have a positive active weight (an overweight) if a stock’s forecast alpha is positive, and to have a negative active weight (an underweight) if a stock’s forecast alpha is negative.
The obvious downside to this approach is that if we have a negative signal for a stock (that is, an alpha forecast of a stock that tells us it is likely to fall relative to peers) then the best we can do is to avoid owning it – a zero holding. Said another way the biggest underweight we can have for a stock is the negative of its benchmark weight.
A zero holding is not efficient - if we could somehow construct a negative holding, we could better exploit the forecast. How could we generate a negative holding? By shorting the stock.
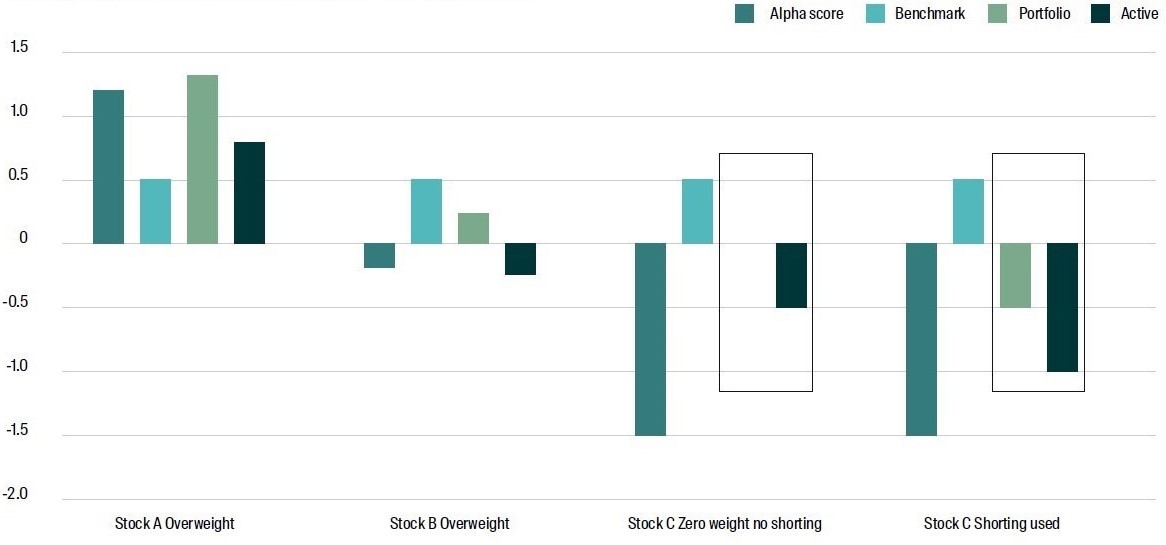
We discuss at a high level the mechanics of long short investing in the next section, but for now the chart below should help to illustrate the problem. Chart 1 is a set of simple examples of stock positions leading from alpha forecasts (or scores4):
Stock A:
A stock with a strong positive alpha score which is overweight.
Stock B:
A stock with a small negative alpha score which is underweight, but for which we still hold a position.
Stock C:
A stock with a large negative alpha score which in a long only portfolio has a zero weight.
Stock C again:
This time when shorting is available, the portfolio holds a negative position, and the active weight more accurately reflects the alpha score.
Chart 1: Various portfolio weight outcomes for a set of alpha scores
Source: RQI
By allowing short positions, we unlock the full potential of our alpha insights. Long-short portfolios provide a more efficient expression of both positive and negative views on individual stocks, significantly enhancing the portfolio’s ability to generate higher alpha. While traditional long-only investing plays an important role for certain client needs, it inherently limits how fully a manager can implement their best investment ideas - particularly when targeting higher levels of active return. Long-short strategies5 directly address these limitations, enabling managers to better align portfolio construction with their highest-conviction alpha opportunities.
In summary, long-short portfolio design provides a more complete and efficient expression of our alpha model. It allows us to fully implement our insights, capturing higher alpha potential for clients who seek stronger returns and who are comfortable with higher active risk.
Mechanics of Short Selling
There are a lot of details in the proper construction of a long-short portfolio, and many of these details are operational rather than investment driven; that is, diving into them will not be useful in getting an understanding of the process. So here we will give a high-level description of the process of shorting in practice.
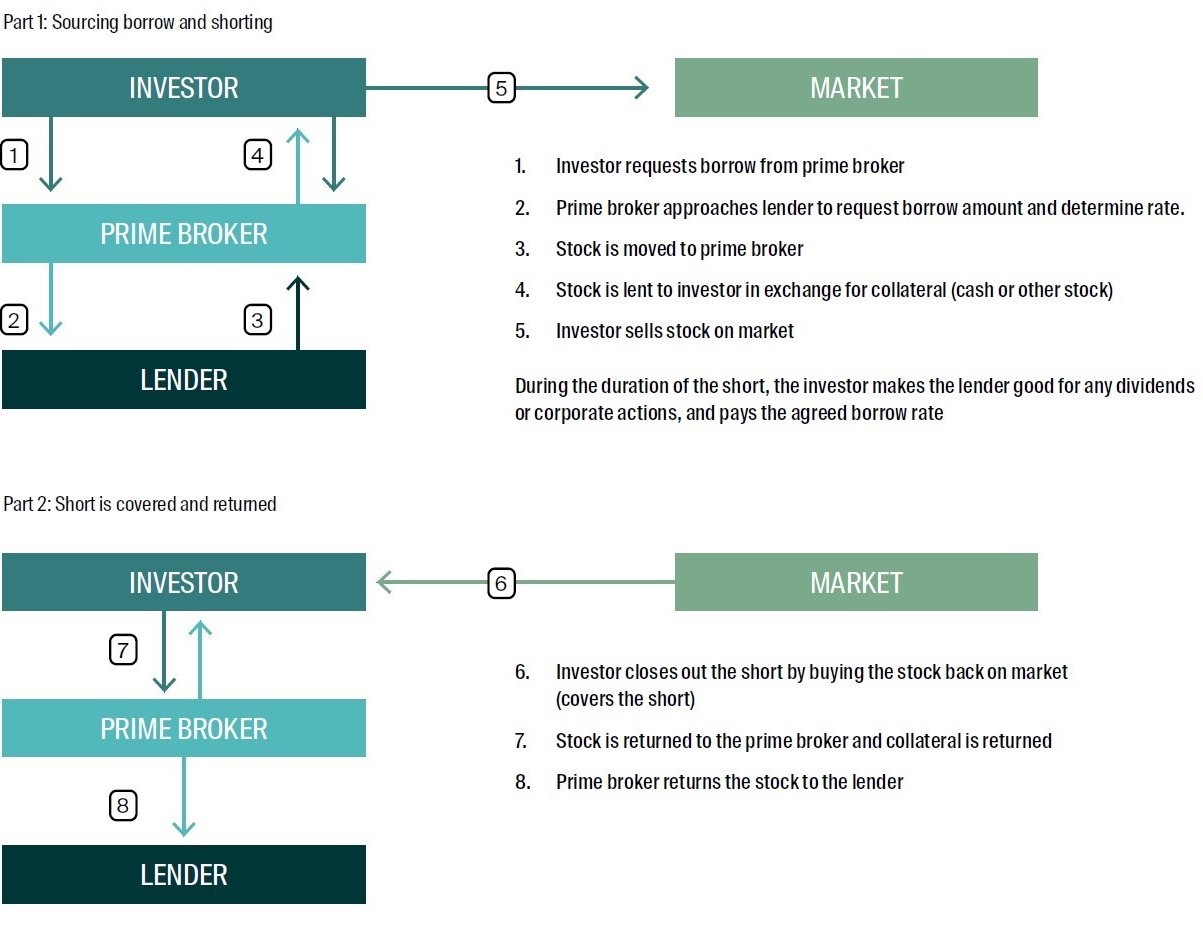
Shorting is selling a stock that you don’t own – but you have a view that it will fall in value, and you want to take advantage of it. The process:
- Find an existing owner (the lender) from whom you can borrow the stock (with the aim of returning it later). Owners are often large index funds or asset owners who are unlikely to trade the stock very often.
- Pay the owner a borrow cost and provide collateral to their satisfaction (for example: cash or other stock you own). The owner retains the right to ask you to return the stock (known as “recall”) at any time.
- You now have legal right to sell the stock, which you do. You are now short the stock.
- While you are holding the short position, you have to make the owner good for any other events that might occur – for example, if a dividend is paid, you must pay the owner the same amount.
- When you no longer need the short position, you buy the stock back (known as “covering” the short) and return it to the owner. If your trade has been correct, you will buy back at a lower price than you sold, locking in a profit.
Both you and the owner both benefit from this arrangement – you to sell the stock and the owner to get a further return on a stock in their portfolio. A Prime Broker (a division of an investment bank) usually facilitates the process.
Chart 2 below shows this as a block diagram.
Chart 2: Block diagram of the shorting process
Source: RQI
In summary
- Decide to short a stock, to capture forecast downside.
- Approach a lender through a prime broker.
- Borrow the stock.
- Provide collateral for stock you borrow and pay a borrow charge to the owner.
- “Make good” the lender during this time.
- Close out the short when finished - buy it back, return it and receive your collateral back.
RQI Long Short Portfolio Construction and Adaptive Leverage: Maximise IR with an active risk target.
Now we step up a gear and talk about portfolio construction and outcomes.
To obtain higher alpha (active return), we need to take higher active risk. In turn, higher active risk requires us to take larger active weights. If we construct the portfolio properly, we maximise information ratio – the best active return for active risk taken.
Can long only deliver this? Only to a point. Beyond a certain level of active risk, there is no benefit as active return does not increase – the absence of shorting restricts the portfolio on its underweight side.
As we seek to increase return (by taking on more risk) we need to increase the active weights. A long only portfolio is constrained by this on the underweight side - it can only go underweight up to the benchmark weight. Smaller cap companies are therefore limited in how far underweight we can go and how much risk we can take. As a result, targeting higher active risk with a long-only constraint inevitably leads to greater portfolio concentration, since larger active positions must increasingly be focused on fewer stocks. If we then try to mitigate this concentration by placing tighter asset-level bounds on how far a portfolio weight can deviate from its benchmark, we end up with portfolios that are unable to reach the desired higher levels of active risk.
Bottom line, the long only constraint prevents us from increasing active return. Trying to increase active risk in long only strategies beyond a certain point does not add alpha.
The charts below help to show this dynamic. Chart 3 below plots the relationship between targeted ex-ante active risk and two characteristics of the long-only portfolio: transfer coefficient, which we use here as a measure of portfolio efficiency (how well the portfolio weights align with the model’s alpha signals), and number of stocks held, which serves as a proxy for portfolio concentration.
Chart 3: Portfolio efficiency and concentration against active risk simulated LO portfolios
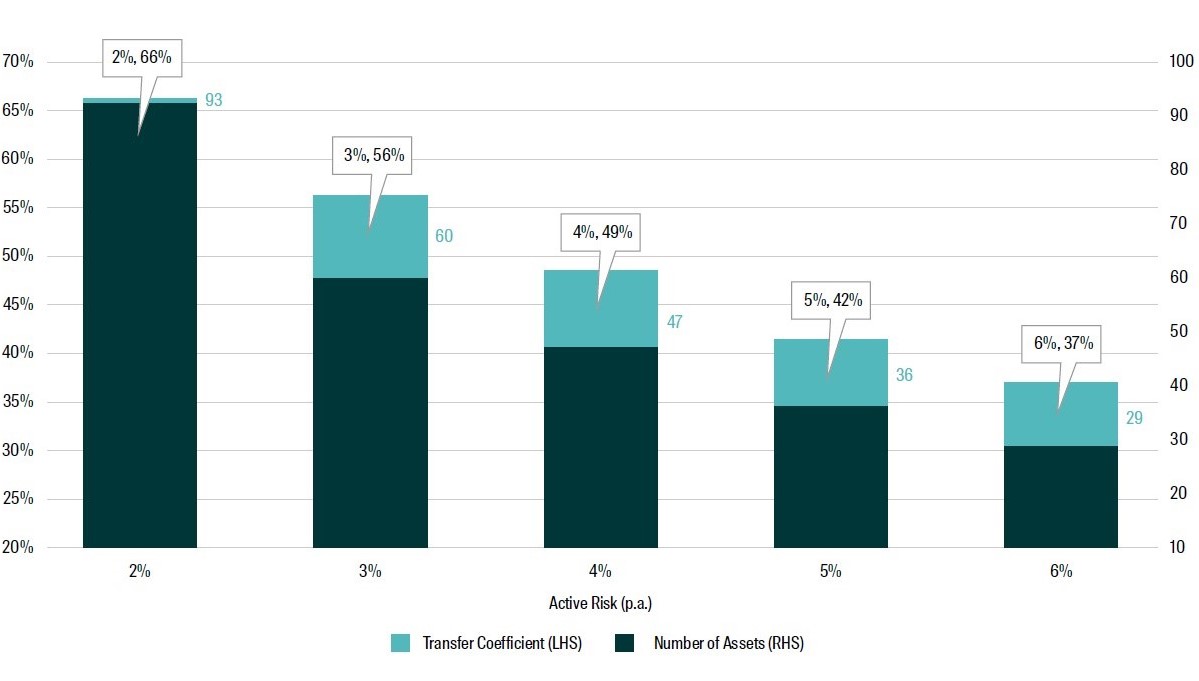
Source: RQI. This chart is illustrative only and based on simulated portfolios at varying active risks.6
As the target active risk increases, we observe two effects.
First, the number of stocks in the portfolio falls—indicating increasing concentration. Going from 2% to 6% active risk effectively reduces the breadth of the strategy from 93 stocks to less than 30 – a factor of more than three.
Second, the transfer coefficient declines by almost half over this same range—suggesting the portfolio becomes less efficient at expressing the alpha signals as active risk increases.
In short, as we target higher active risk under the long-only constraint, we end up with portfolios that are more concentrated and less aligned with our model’s insights.
Chart 4 looks at this issue from an alternative perspective when we add asset bounds to avoid the portfolio concentration as in the previous scenario. Panel A plots the realised risk of simulated long only portfolios through time for differing levels of target active risk, while Panel B shows the realised active share over time for these strategies. We notice that the active share does not increase as the target risk is increased, nor are we able to reach higher levels of active risk – realised tracking error (TE) reaches a maximum of about 2.5% for any target TE above about 3%.
Chart 4: Panel A: Plot of realised risk against target active risk in a simulated LO portfolio
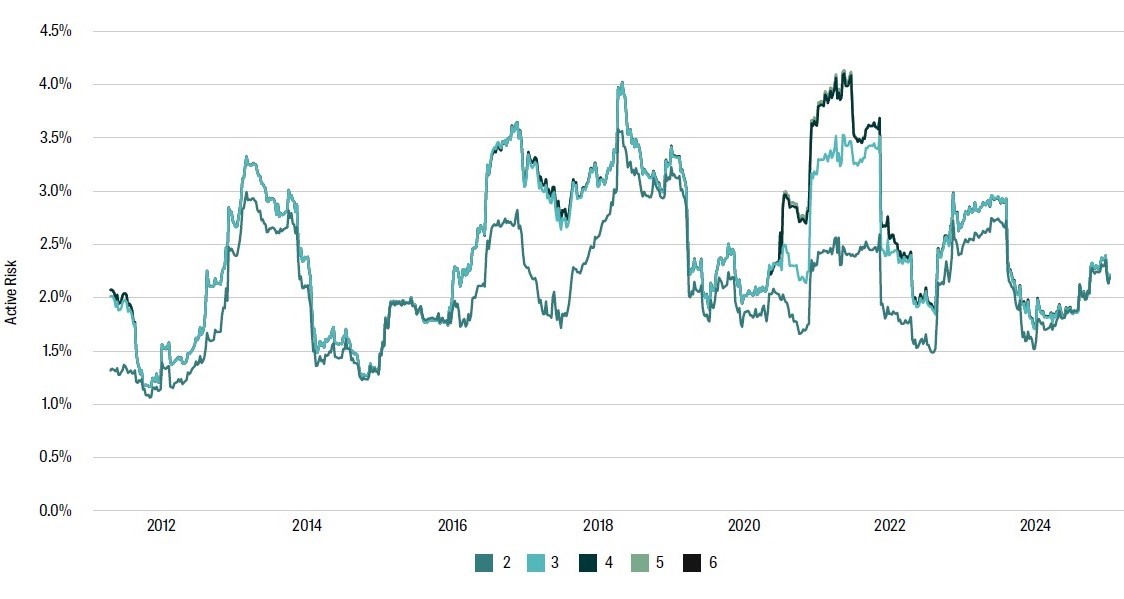
Source: RQI, Factset. Data as at 31 December 2024
Chart 4: Panel B: Plot of active share against target active risk in a simulated LO portfolio

Source: RQI, Factset. Data as at 31 December 2024
In Chart 4 Panels C and D we can see this more clearly. These are scatterplots of forecast alpha versus active weights for the long-only strategies, shown for a 2% target active risk in panel C and a higher target of 6% in Panel D. The date chosen is end of Dec 2024. At the 2% risk level, there is a strong alignment between the alpha scores and the resulting active weights, but it is hampered by the long only constraint. Under the higher risk target, we do not actually realise the target as we have seen above, and the distribution of active weights against alpha scores only changes marginally. (Compare this with Chart 8 below, when we allow shorting.)
Chart 4: Panel C: Active weight vs alpha score for simulated LO at low active risk (2%)
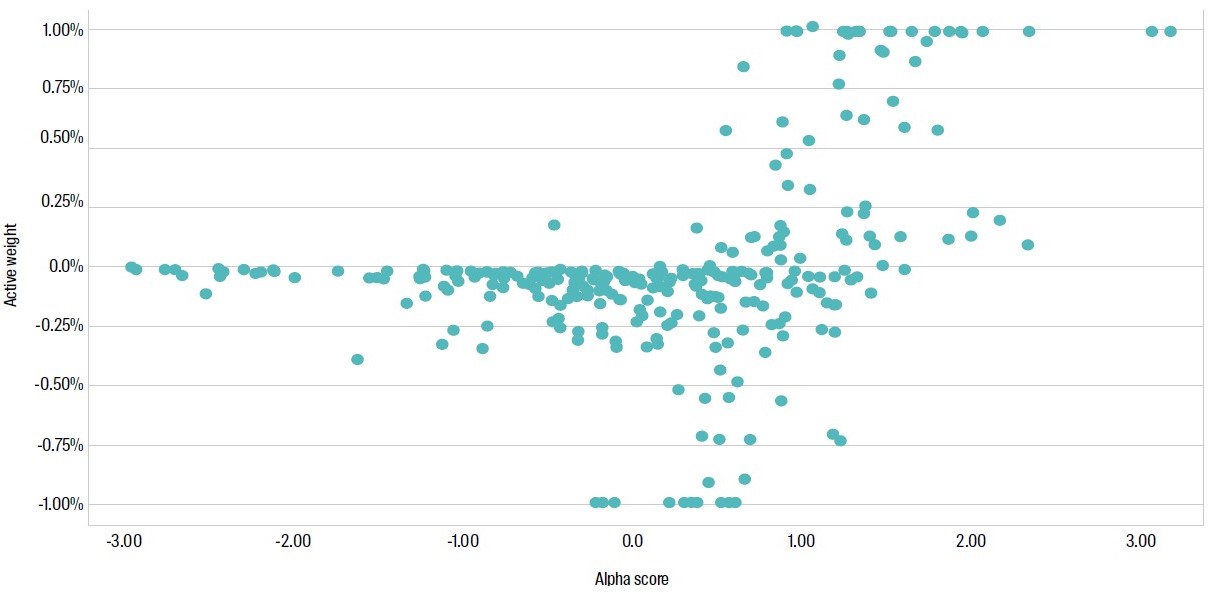
Source: RQI, Factset. Data as at 31 December 2024
Chart 4: Panel D: Active weight vs alpha score for simulated LO at high active risk (6%)
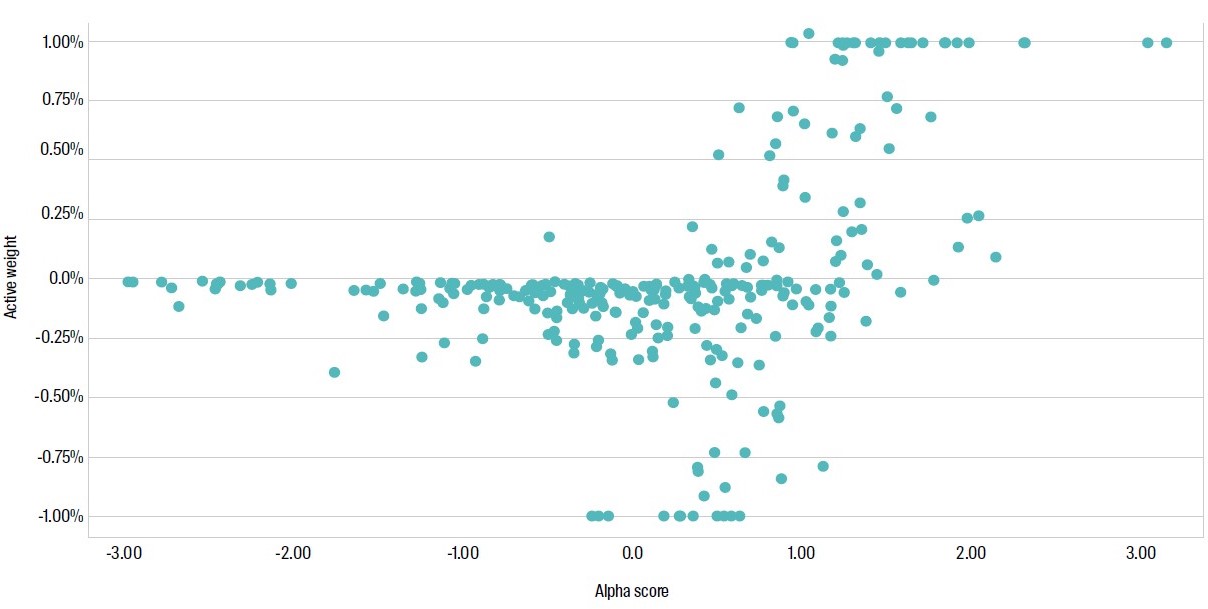
Source: RQI, Factset. Data as at 31 December 2024
Long only portfolio construction is clearly inefficient for higher levels of risk – that is, when targeting higher levels of realised alpha. So how do we do this?
The answer is Adaptive Leverage.
Leverage is the extent that the long-short portfolio is long and short in aggregate. Shorthand naming might say that a long-short portfolio is 130/30. What this means is that portfolio can be 30% short when we add up all short position weights. Or that up to 30% of the fund NAV can be short.
By going 30% short, we sell (short) 30% of the NAV and then use that 30% cash raised to purchase 30% more on the long side – that is, 130% long. The total net investment is 100%, but we arrive there using 130/30 leverage.
Let’s do an example. Assume our fund has a NAV of $100m. Here are the steps:
- Borrow and the short sell $30m of exposure.
- Combine the $30m raised with the $100m NAV to get $130m.
- Purchase (go long) $130m of exposure.
One very real problem in long-short portfolio construction is fixation on a certain level of leverage, like 130/30. We believe that targeting a level of active risk is more efficient, letting the portfolio construction process adapt leverage to find the optimum IR7.
The choice of active risk is the critical decision - not the fixed level of leverage. At RQI, we have closely examined our alpha model and portfolio construction process and believe that targeting an active risk in the range of 4% to 5% within a long-short framework provides the best opportunity to realise strong and consistent alpha outcomes.8
Targeting a certain level active risk is difficult if we lock down leverage at a certain level as part of the construction (for example, 130/30). Volatility of the market and factors can change so we may over or undershoot our target. For example, in a low volatility market it may be hard to take on risk - increasing risk requires an increase in leverage. Yet if leverage is constrained at 130/30, it may be that you can never achieve the level of risk that you target.
However, if we use adaptive leverage, we are less constrained. Leverage is allowed to vary within a defined range, enabling the portfolio to maintain its target level of active risk more effectively across changing market conditions. In periods of lower market volatility, higher leverage may be required to reach the desired risk level; in more volatile environments, lower leverage can help contain risk.
This flexibility means that the portfolio is not forced into suboptimal positioning due to a fixed leverage constraint. Instead, adaptive leverage supports a more consistent expression of alpha, helping to preserve efficiency and maximise information ratio over time.
The RQI Australian Diversified Alpha Long-Short strategy is constructed using this adaptive approach. While leverage is capped at a maximum of 160/60, the actual level adjusts dynamically—typically ranging between 140/40 and 160/60 when targeting an active risk of approximately 4% - 5%. This allows the portfolio to respond to changing conditions while maintaining alignment with the underlying alpha model.
To avoid lengthy repetitive descriptions, we use the abbreviation ALmaxZZZ to describe adaptive leverage up to a maximum of ZZZ. For example, adaptive leverage up to a maximum of 130/30 is named ALmax130.
A summary of simulated outcomes
We have conducted a range of simulations on our RQI Australian Diversified Alpha Long-Short strategy to better appreciate likely active returns and risk.9 These use different settings of risk and leverage to illustrate our approach and conclusions. The results below arise from these simulations.
The data sample is Jan 2010 to Dec 2024 and summary simulation results are below. More extensive results and analysis appear in the second paper on RQI Long-Short. Below we use the following naming convention:
Long Only LO
Long Short with Adaptive Leverage to max 130/30 ALmax130
Long Short with Adaptive Leverage to max 160/60 ALmax160
Table 1: Simulation Summary Table. All strategies targeting 4-5% active risk

Source: RQI, Factset. Data as at 31 December 2024. Past simulated performance is hypothetical in nature, it is no guarantee of future performance and is not indicative of the actual performance achieved by these portfolios previously, now or in the future. Actual results may differ from the above. Past performance is no indication of future performance.
Table 1 gives a summary of the simulations we conducted here. As we increase maximum leverage, the return achieved for risk taken improves. Active risk also grows, trying to hit the 4-5% target, but the long only case is unable to realise this target. ALmax130 achieves this active risk target but the alpha is considerably less that our intended RQI Long-Short (ALmax160), which reaches about 6.5% alpha with a realised active risk of just over 4%.
Chart 5 shows the simulated cumulative alpha for long only, ALmax130 and ALmax160. The alpha improvement when we add leverage is stark, as we saw in Table 1. The step from ALmax130 to ALmax160 is smaller, as much of the benefit from leverage occurs simply by unlocking the long only constraint. However, allowing more leverage about ALmax130 does add value, however.
Chart 5: Simulated Cumulative alpha
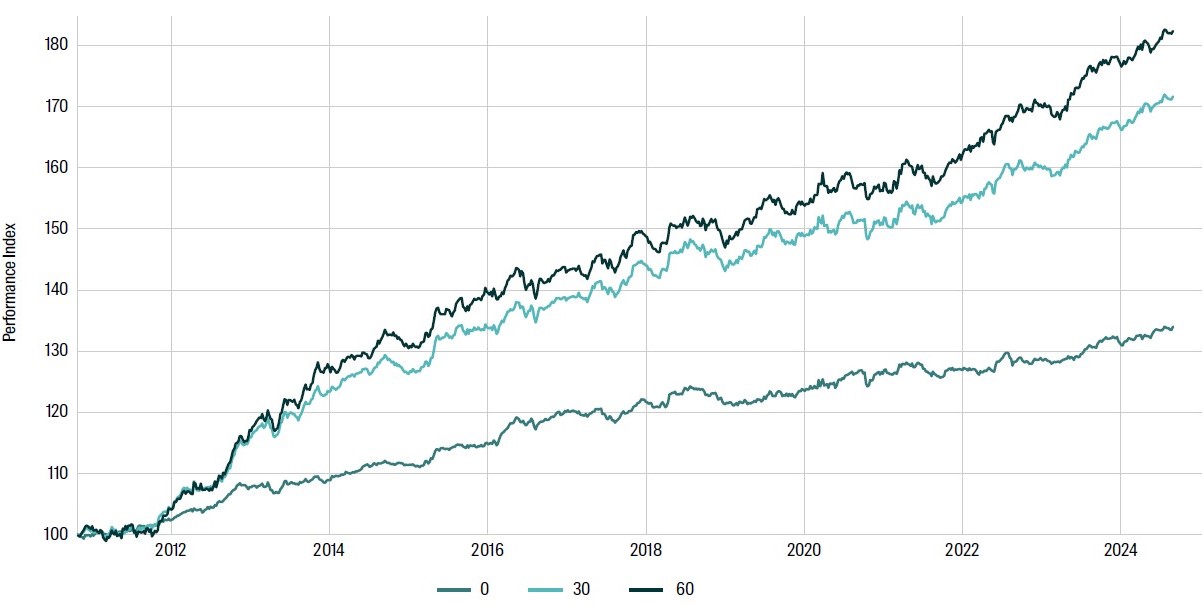
Source: RQI, Factset. Data as at 31 December 2024. Past simulated performance is hypothetical in nature, it is no guarantee of future performance and is not indicative of the actual performance achieved by these portfolios previously, now or in the future. Actual investment results may differ from the above. Past performance is no indication of future performance.
Each simulation targets an active risk level within the 4% to 5% range. As noted earlier, this target cannot be achieved under the long-only constraint. Chart 6 below shows the 12-month rolling realised active risk for the Long-Only, ALmax130, and ALmax160 simulations. While realised active risk fluctuates over time (as expected), only the long-short portfolios - ALmax130 and ALmax160 - are able to consistently reach and maintain active risk levels in line with the intended range.
Chart 6: Rolling 12 month realised active risk simulations (recall target is 4-5%, actual will vary)
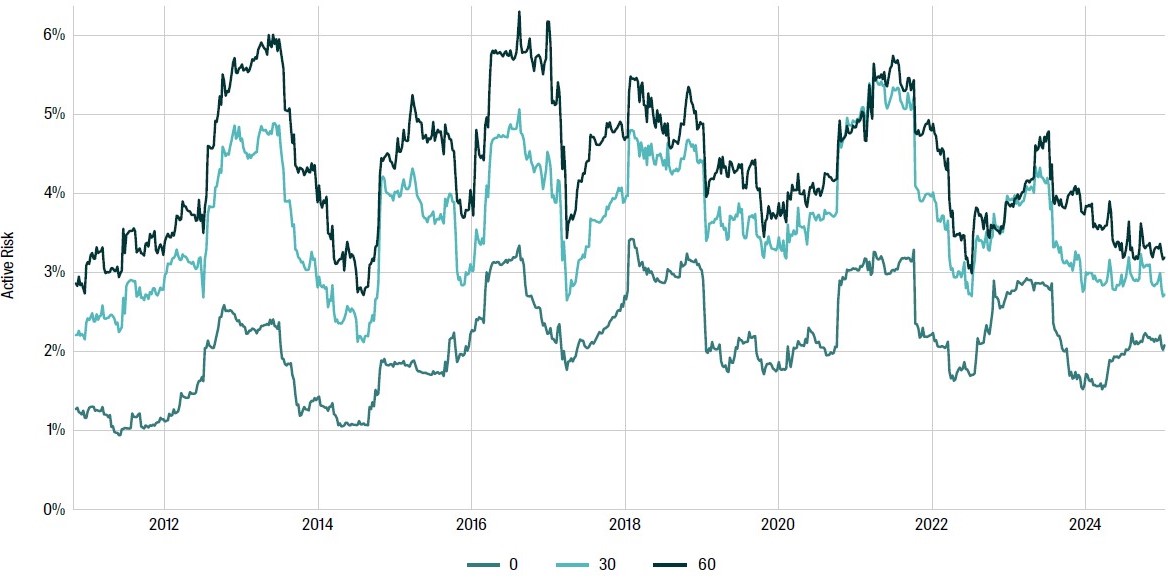
Source: RQI, Factset. Data as at 31 December 2024. Past simulated performance is hypothetical in nature, it is no guarantee of future performance and is not indicative of the actual performance achieved by these portfolios previously, now or in the future. Actual results may differ from the above. Past performance is no indication of future performance.
A primary question that arises from using adaptive leverage is for what periods (and for how long) is the maximum leverage reached. Chart 7 shows the actual leverage (long and short) for the ALmax160 simulation.10
Maximum leverage is only reached on a couple of occasions and varies between 145% and 160% over the sample period. Recall that the portfolio construction is designed to maximise information ratio with a target active risk of 4-5%. If the portfolio can achieve this at a lower leverage than the maximum, it does so.
Chart 7: Panel A: Simulated Long Side Leverage for ALmax160
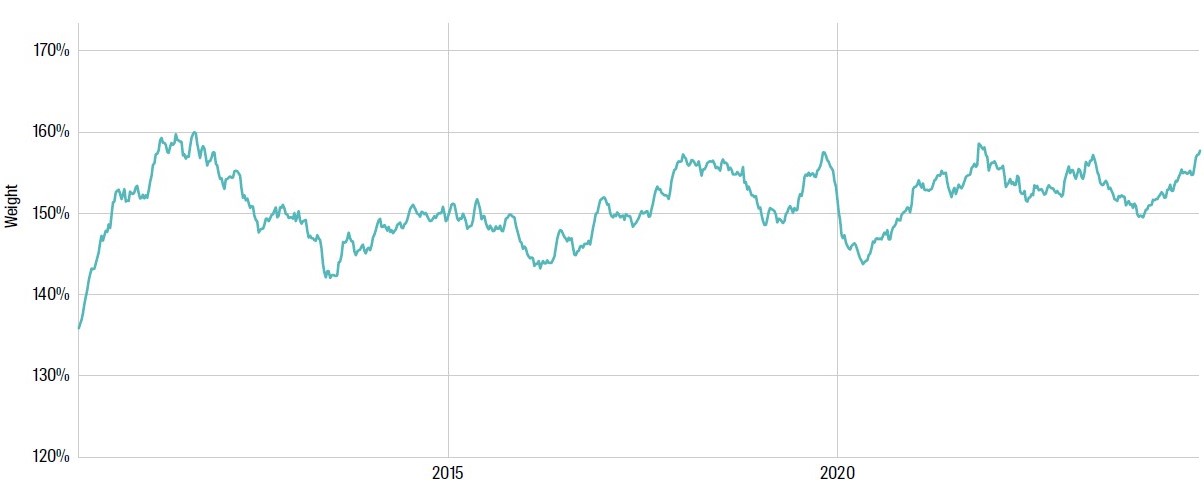
Source: RQI, Factset. Data as at 31 December 2024. Past simulated performance is hypothetical in nature, it is no guarantee of future performance and is not indicative of the actual performance achieved by these portfolios previously, now or in the future. Actual results may differ from the above. Past performance is no indication of future performance.
Chart 7: Panel B: Simulated Short Side Leverage for ALmax160
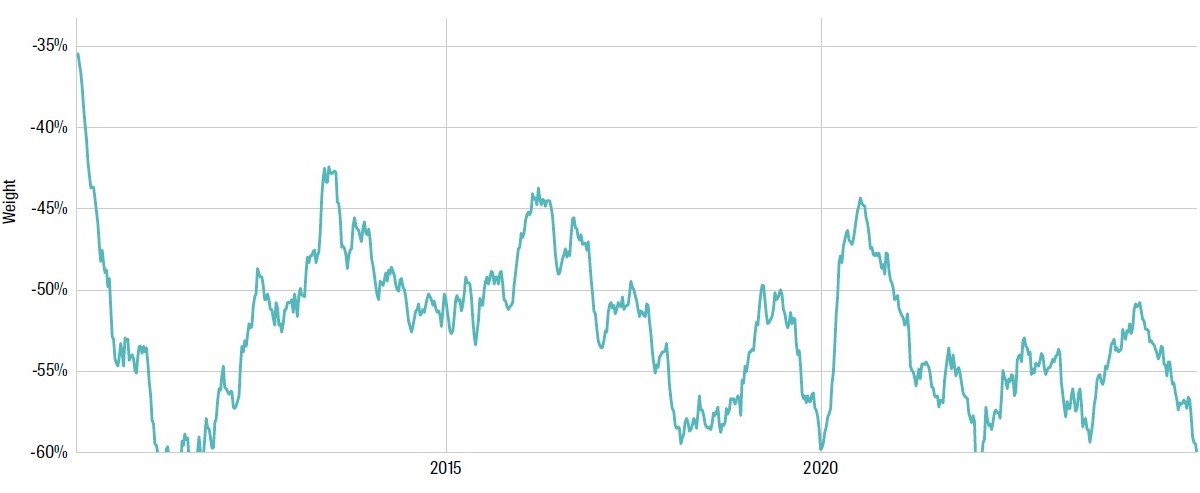
Source: RQI, Factset. Data as at 31 December 2024. Past simulated performance is hypothetical in nature, it is no guarantee of future performance and is not indicative of the actual performance achieved by these portfolios previously, now or in the future. Actual results may differ from the above. Past performance is no indication of future performance.
Finally, Chart 8 below shows scatterplots of our alpha forecasts (end of Dec 2024) with the active weight at the same time for adaptive leverage to max 160/60. We can see a clear correlation of alpha (X-axis) with active weight (Y-axis) which is very different to (much more efficient than) what we saw in Chart 4 Panel D (long only).
Chart 8: Active weight vs alpha score for ALmax160 simulation
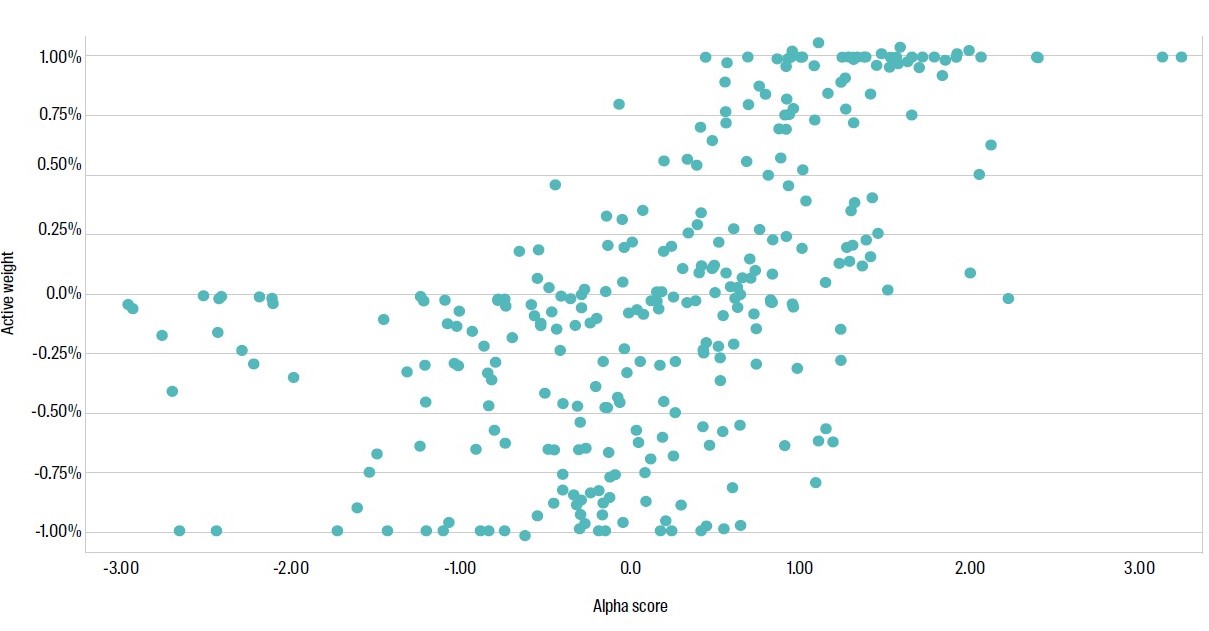
Source: RQI, Factset. Data as at 31 December 2024. Past simulated performance is hypothetical in nature, it is no guarantee of future performance and is not indicative of the actual performance achieved by these portfolios previously, now or in the future. Actual results may differ from the above. Past performance is no indication of future performance.
Why RQI LS? Why are we different and why we believe this is better.
In this note we have introduced the concept of long short equity investing and compared it to the more conventional long only approach. We have also described the mechanism of long short as this is sometimes not clear.
At RQI, our goal is to offer equity solutions tailored to a wide spectrum of investor needs. Traditional long-only strategies continue to be valuable, particularly for investors seeking reliable outcomes at lower active risk levels. However, investors aiming for higher active risk to capture greater alpha potential face limitations in long-only portfolio construction.
This is where long-short investing comes in. Typically, the industry defines long-short strategies by fixed leverage ratios— common examples being 130/30. At RQI, we believe defining long-short investing purely by fixed leverage ratios is suboptimal, as it introduces similar constraints to those inherent in long-only investing.
Instead, we introduce the concept of Adaptive Leverage. By allowing leverage to vary dynamically up to a prudent maximum (for example, up to 160/60 in our Australian Long-Short strategy), we target an optimal range of active risk (approximately 4% - 5%). This dynamic approach ensures flexibility, avoiding forced constraints that can lead to unintended outcomes such as inefficiently skewed portfolio positions or difficulty in achieving targeted risk levels.
Our simulations, spanning from January 2010 to January 2025, demonstrate clear advantages in adopting adaptive leverage.11 By dynamically adjusting portfolio leverage, we more fully realize our alpha potential and achieve greater portfolio efficiency.
We acknowledge that this high-level overview invites further questions regarding portfolio concentration, risk factor exposure, and other more technical aspects of our methodology. These important topics will be covered comprehensively in a follow-up paper currently in production.
In summary, Adaptive Leverage, combined with our proven alpha model, positions RQI’s Long-Short strategy to efficiently deliver the potential of superior alpha outcomes for investors seeking higher active returns, while still respecting and recognizing the important role that traditional long-only portfolios play for many clients.
RQI Investors
We combine powerful quantitative analysis with human insight, aiming to deliver strong investment performance
Our proprietary quantitative equities approach is founded on proven data combined with the disciplined application of meaningful economic fundamentals that aims to enhance investment performance.
1 “Jabberwocky” is a poem published in 1871 by Lewis Carroll
2 By this we mean the efficient transfer of our signal forecasts into stock positions.
3 Active return (or alpha) is return with respect to a benchmark. Active risk (or tracking error) is variation of this alpha over time.
4 To standardise our signal forecasts, we “score” them, which means ranking them from best to worst. (In more technical terms, we Z-score them, which is to subtract the mean and divide by the standard deviation). The largest score is +3, the lowest is -3, and more scores are around the middle than in the tails.
5 In particular, using the concept of adaptive leverage. We define this idea in more detail later.
6 These are simulated results for this strategy, using long only portfolio construction at different levels of active risk target. Details for how these simulations are built appear below.
7 A second (more technical) paper on long short, which will follow this, looks into this question, among others.
8 This is not to say that this is the only level of active risk where our alpha model will work. In simple terms it works like this:
- With alpha expectations up to about 2%, or if there is an unwillingness to move to long-short, targeting 1-2% active risk works very well in a long only world.
- With high alpha expectations up to 4-6%, and flexibility in terms of shorting, long-short with an active risk of about 3 - 5% might suit. Our research suggests RQI’s alpha model works well in long-short at about 4-5% active risk.
- To target higher alpha expectations (say 6-10%) would require a market-neutral portfolio with even higher active risk (5-6%), which has more limited capacity and can be less palatable to many clients.
9 Our Australian Diversified Alpha Long Short strategy starts with the investment universe which is the ASX300. We apply an alpha model to score all securities within this universe, consisting of key families of signals which contain a range of individual stock specific insights. We select all insights based on their economic rationale and efficacy in explaining future returns - all determined by rigorous empirical testing and model building. Importantly, the short positions are determined by the same rigorous alpha model used for long positions. Once alphas are constructed, we combine them with risk and trading cost forecasts to target the strategy’s objectives, allowing for no shorting, shorting up to 30% and shorting up to 60% (the last two via adaptive leverage). To do this we apply sophisticated quantitative optimisation techniques, but with portfolio construction parameters in common across the various simulations so that the impact of constraints is made clear.
10 We only really need to show one or the other, and they must sum to 100%.
11 Past simulated performance is hypothetical in nature, it is no guarantee of future performance and is not indicative of the actual performance achieved by these portfolios previously, now or in the future. Actual results may differ from the above. Past performance is no indication of future performance.
Read our latest insights
Important Information
This material has been prepared and issued by First Sentier Investors (Australia) IM Ltd (ABN 89 114 194 311, AFSL 289017) (FSI AIM), which forms part of First Sentier Investors, a global asset management business. First Sentier Investors is ultimately owned by Mitsubishi UFJ Financial Group, Inc (MUFG), a global financial group. References to “we” or “us” are references to First Sentier Investors. Some of our investment teams use the trading names FSSA Investment Managers, Stewart Investors, Albacore Capital, Igneo Infrastructure Partners and RQI Investors. Not all brands are available in all jurisdictions or to all audiences. A copy of the Financial Services Guide for FSI AIM is available from First Sentier Investors on its Australian website.
This material is directed at persons who are wholesale investors or wholesale clients (as defined under the Corporations Act 2001 (Cth) (Australia) or Financial Markets Conduct Act 2013 (New Zealand)) and is not intended for persons who are retail clients. This material is general information only. It does not take into account your objectives, financial situation or needs. Before making an investment decision you should consider, with a financial advisor, whether this information is appropriate in light of your investment needs, objectives and financial situation. The information in the material does not constitute an offer of, or an invitation to purchase or subscribe for any securities.
Any opinions expressed in this material are the opinions of the individual author at the time of publication only and are subject to change without notice. Such opinions: (i) are not a recommendation to hold, purchase or sell a particular financial product; (ii) may not include all of the information needed to make an investment decision in relation to such a financial product; and (iii) may substantially differ from other individual authors within First Sentier Investors.
Reference to specific securities (if any) is included for the purpose of illustration only and should not be construed as a recommendation to buy or sell the same. Any securities mentioned herein may or may not form part of the holdings of a First Sentier Investors portfolio at a certain point in time, and the holdings may change over time.
We have taken reasonable care to ensure that this material is accurate, current, complete and fit for its intended purpose and audience as at the date of publication. No assurance is given or liability accepted regarding the accuracy, validity or completeness of this material and we do not undertake to update it in future if circumstances change. No part of this material may be reproduced or transmitted in any form or by any means without the prior written consent of FSI AIM.
Any performance information has been calculated gross or net of management fees (where indicated) and net of transaction costs. No allowance has been made for taxation. Past performance is not indicative of future performance.
Copyright © First Sentier Investors, 2025
All rights reserved.
