
Equity markets in 2025 unfolded in ways few investors would describe as familiar. Political uncertainty, abrupt policy shifts and sharp reversals in risk appetite combined with an ongoing surge in technology-led enthusiasm to produce market behaviour that challenged many long-held assumptions. Traditional relationships between risk, valuation and return broke down, leaving even well-established investment styles struggling to behave as expected.
David Walsh’s latest paper explores this extraordinary period in global equity markets, focusing on what sat beneath the headline volatility and why outcomes diverged so sharply from historical experience.
From Risk-Off to Risk-On-and Back Again
2025 was marked by rapid transitions between caution and exuberance. Periods of heightened uncertainty triggered sharp sell-offs, only to be followed by equally powerful rallies as policy fears eased and investor sentiment reversed. These swings are illustrated in the sharp drawdown and recovery of global equity indices over the course of the year (Chart 1).
Chart 1: Cumulative Index Returns: MSCI World and MSCI World (US stocks only) (in AUD)
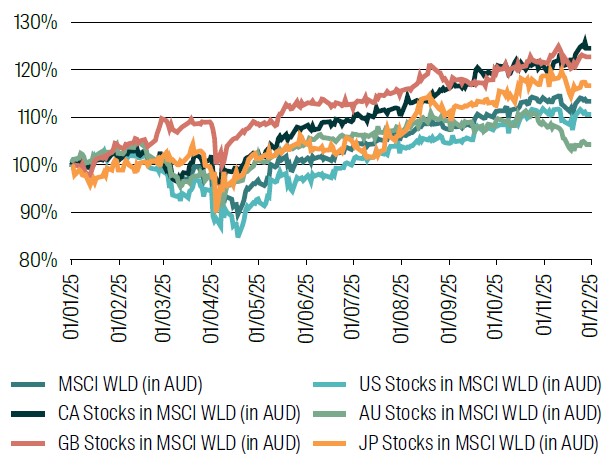
From: 1 January 2025 to 1 December 2025
Source: RQI Investors, MSCI, 2026
These shifts were not evenly distributed across markets. Sector returns before and after key policy inflection points reveal stark differences in performance, particularly between technology, defensive and more cyclical areas of the market (Table 1).
Table 1: Sector returns in US MSCI World stocks – before and after “Liberation Day”
Again, note returns are in AUD, so bottom of the market was actually April 21.
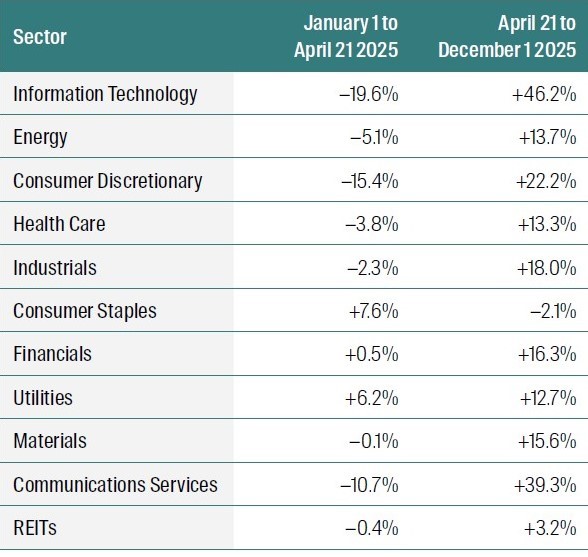
From: 1 January 2025 to 1 December 2025
Source: RQI Investors, MSCI, 2026
Concentration, Shorts and Market Structure
One of the defining features following “Liberation Day” was how strongly returns clustered around particular stocks and characteristics. Technology and communications stocks dominated market leadership, while heavily shorted names and high-beta stocks experienced some of the most dramatic reversals. The rebound in heavily shorted stocks was especially pronounced following the market trough (Chart 2), while the largest technology stocks also played a central role in driving index returns (Table 2).
Table 2: Mag 7 fall and bounce, before and after “Liberation Day”1, plus % short at December 1 20252
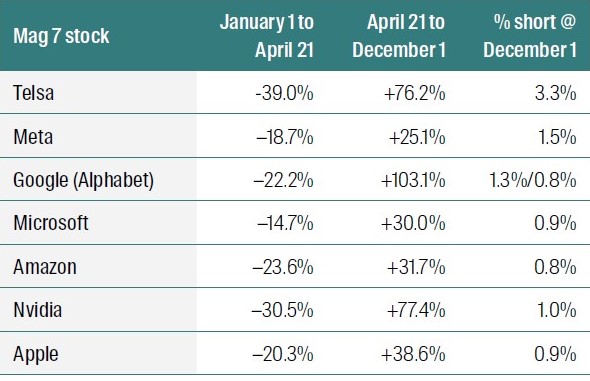
From: 1 January 2025 to 1 December 2025
Source: RQI Investors, MSCI, 2026
When Familiar Factors Stop Behaving Normally
Factor-based investing also faced a challenging environment. Quality, value, size and volatility factors – typically relied upon for diversification and risk management –delivered unexpected outcomes. High-beta stocks underperformed sharply during the sell-off, before dramatically outperforming during the subsequent rally (Chart 3).
Chart 3: Cumulative Returns to 100 highest and 100 lowest beta US Stocks in MSCI World (in AUD), equally weighted
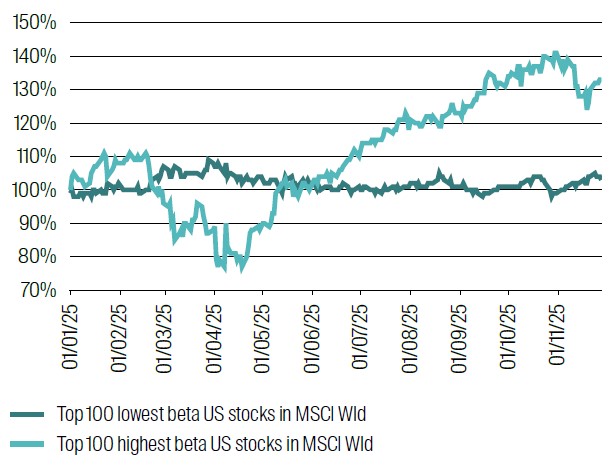
From:1 January 2025 to 1 December 2025
Source: RQI Investors, MSCI, 2026.
Smaller stocks lagged larger peers into the market trough and recovered at a similar pace thereafter (Chart 4), while higher-quality stocks, measured by return on equity, delivered stronger rebounds than lower-quality counterparts (Chart 5). At the same time, expensive stocks significantly outperformed value stocks for much of the year, highlighting the unusual nature of factor returns during this period (Chart 6).
Chart 6: Cumulative Returns to 100 most expensive and 100 best value US stocks in MSCI World (in AUD)
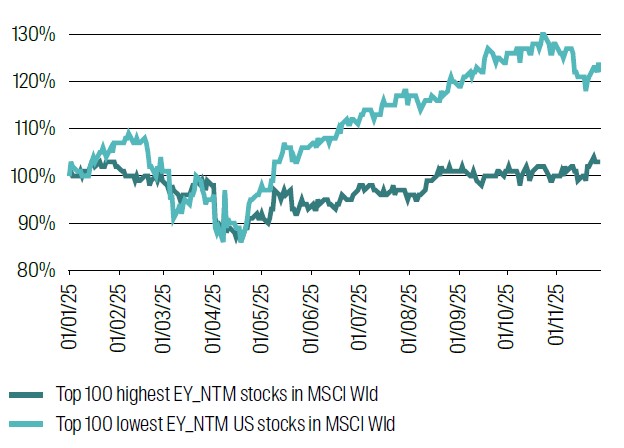
From: 1 January 2025 to 1 December 2025
Source: RQI Investors, MSCI, 2026
Making Sense of an Abnormal Market
Rather than offering prescriptive outcomes or forecasts, Far From Normal provides a framework for understanding why markets behaved as they did by breaking the year into its underlying drivers and examining how policy uncertainty, investor positioning and market structure combined to produce outcomes that were far removed from historical norms.
Explore the full article to understand what made 2025 far from normal, and how these dynamics can inform interpretation of recent market behaviour across different regions, sectors and investment styles.
RQI Investors
We combine powerful quantitative analysis with human insight, aiming to deliver strong investment performance
Our proprietary quantitative equities approach is founded on proven data combined with the disciplined application of meaningful economic fundamentals that aims to enhance investment performance.
1 Yes, Google has had a greater than 100% return since April 21.
2 Reference to specific securities (if any) is included for the purpose of illustration only and should not be construed as a recommendation to buy or sell the same. All securities mentioned herein may or may not form part of the holdings of RQI Investors’ portfolios at a certain point in time, and the holdings may change over time.
Explore our latest insights
Important Information
This material has been prepared and issued by First Sentier Investors (Australia) IM Ltd (ABN 89 114 194 311, AFSL 289017) (FSI AIM), which forms part of First Sentier Group, a global asset management business. First Sentier Group is ultimately owned by Mitsubishi UFJ Financial Group, Inc (MUFG), a global financial group. References to “we” or “us” are references to First Sentier Group. Some of our investment teams use the trading names First Sentier Investors, FSSA Investment Managers, Stewart Investors, Albacore Capital, Igneo Infrastructure Partners and RQI Investors. Not all brands are available in all jurisdictions or to all audiences. A copy of the Financial Services Guide for FSI AIM is available from First Sentier Investors on its Australian website.
This material is directed at persons who are wholesale investors or wholesale clients (as defined under the Corporations Act 2001 (Cth) (Australia) or Financial Markets Conduct Act 2013 (New Zealand)) and is not intended for persons who are retail clients. This material is general information only. It does not take into account your objectives, financial situation or needs. Before making an investment decision you should consider, with a financial advisor, whether this information is appropriate in light of your investment needs, objectives and financial situation. The information in the material does not constitute an offer of, or an invitation to purchase or subscribe for any securities.
Any opinions expressed in this material are the opinions of the individual author at the time of publication only and are subject to change without notice. Such opinions: (i) are not a recommendation to hold, purchase or sell a particular financial product; (ii) may not include all of the information needed to make an investment decision in relation to such a financial product; and (iii) may substantially differ from other individual authors within First Sentier Group.
Reference to specific securities (if any) is included for the purpose of illustration only and should not be construed as a recommendation to buy or sell the same. Any securities mentioned herein may or may not form part of the holdings of a First Sentier Group portfolio at a certain point in time, and the holdings may change over time.
We have taken reasonable care to ensure that this material is accurate, current, complete and fit for its intended purpose and audience as at the date of publication. No assurance is given or liability accepted regarding the accuracy, validity or completeness of this material and we do not undertake to update it in future if circumstances change. No part of this material may be reproduced or transmitted in any form or by any means without the prior written consent of FSI AIM.
Any performance information has been calculated gross or net of management fees (where indicated) and net of transaction costs. No allowance has been made for taxation. Past performance is not indicative of future performance.
Copyright © First Sentier Group, 2026
All rights reserved.
