
Corporate culture is a powerful dynamic in a company. It is the set of beliefs and attitudes about the way things are done, and so is a key component of many corporate functions.
We often think about corporate culture being driven by the top – the board. The board sets the tone of the organisation and that tone filters down through the management and employees. Getting corporate culture right can be a powerful tool for any company and an important dimension for firm value. It also shapes the internal environment of a firm and influences the behaviour of both management and employee decision-making. Ultimately, this is seen as a driving factor on the success of an organization – it will give employees confidence in their work and their company and keep them motivated to do their best. Whilst it may not be the top item at a board meeting, it will be something on which a board should focus and it is always in the background affecting how things get done.
While intrinsically important for companies it is notoriously difficult to measure. How can you measure how well the corporate culture is embedded through the company? This is not like measuring an objective aspect of the company like sales or % women on the board. One method often used is a company’s employee surveys. These will give an insight into the company, but they are unfortunately not a useful tool for cross company analysis. This is because they are not necessarily conducted annually, their methodology differs between companies, and the results are often not publicly available. Other ways that corporate culture can be captured may be via employee rating sites (e.g., Glassdoor) but this gives more of a view of the happiness of employees and not necessarily the underlying culture of the company.
Here we are using a unique way to try to capture a company’s culture. We analyse conference calls to see if we can capture the strength of a company’s culture via the way management speak.
We then analyse the types of firm attributes that this is related to and whether we can capture stock outperformance by trading on this information.
What is Corporate Culture?
Since the definition of culture can be highly subjective we borrow a definition from the management literature as a ‘set of values and norms widely shared and firmly help by members of an organisation.1
Under the definition above culture is the way of describing how things “get done” in a firm. It will matter to the firm’s performance as we can see it playing a role of a social control mechanism over the employees’ behaviours via peer influence. What do we mean by this? Think about this example: you work in a firm where everyone clocks on at 9am and clocks off at 5pm, not a minute earlier or later. If you come into the business as someone who is willing to put in extra hours, or arrives early or stays late, as you observe those around you and the common practice, you will sooner or later start to conform to the culture and come at 9am and leave at 5pm. The culture will set a tone for how you will work – and you will evolve into that same process. Likewise, if you are someone who shirks at work while those around you are diligently working, again the social pressure from the culture will likely mean that you will change your work habits to adapt to this culture and improve your productivity. The way that the employee’s behaviour can change speaks to the power that a good corporate culture can have on a firm.
And the power that culture can have on a firm means that from an investor perspective it is important to be able to try to measure this and be able to differentiate firms based on those with strong corporate culture and those without.
Background and literature review
This work was motivated by the paper ‘Measuring Corporate Culture Using Machine Learning’ by Li, Mai, Shen and Yan (2021). This paper uses a specialist ‘culture’ dictionary to measure the culture of a company through analysing conference calls.
The authors create a culture dictionary using word2Vec (Mikolev et al. 2013) based on five dimensions of corporate culture: innovation, integrity, quality, respect and teamwork. The choice of these five dimensions of corporate culture are based on the work of Guiso, Sapienza and Zingales (2015): ’The Value of Corporate Culture’. Here the authors, focusing on firms in the S&P 500, had looked at the corporate websites of these firms and found the most mentioned company values resulting in the five above. Whilst every firm did not have all five values, most firms had at least one if not a multiple of the values listed above.
Li et al (2021) then took these core corporate values and built an extensive dictionary around it, using 209,480 earnings calls (7,501 unique firms) from Thomson Reuters Street Events database over 2001 to 2018 to train their word embedding model. For example, words associated with the value integrity is below:
accountability, ethic, integrity, responsibility, transparency, accountable, governance, ethical, transparent, trust, responsible, oversight, independence, objectivity, moral, trustworthy, fairness, hold_accountable, corporate_governance, autonomy, core_value, assure, stakeholder, fiduciary_responsibility, continuity, credibility, honesty, privacy, fiduciary_duty, rigor, empathy, ethic_integrity, egalitarian, fiduciary, utmost, code_ethic, faith, passionately, impartial, compliance, honorable, socially_responsible, ethically, company_culture, solidarity, democracy, stewardship, identity, constituent, governance_model, citizen, scrupulous, society, governance_structure, safety_soundness, humility, decency, meritocracy, reassure, exemplary, business_ethic, act_responsibly, advocacy, controllership, diligent, sincerity
At a high level, the associations we see with the different values are below:
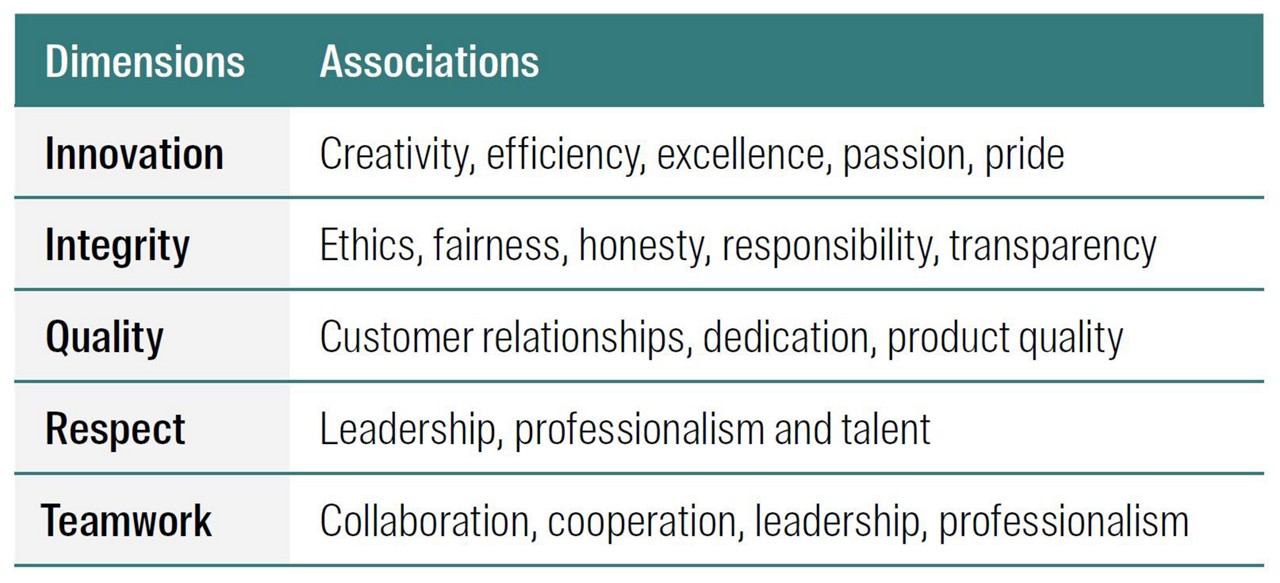
Using these dictionaries, we then measure the strength of the corporate culture looking at conference call data, and then exploring this to see if there is any alpha opportunities.
How are we actually measuring Corporate Culture?
Using the dictionaries from Li et al (2021) we use a bag of words approach on the conference call transcripts for all the five corporate values. The more the words are mentioned, the stronger the culture of the firm.
Note that while there are several different data sources we could use to measure corporate culture (e.g., company website, annual report etc), we chose to use the conference calls. The reason is that the purpose behind these calls is not to publicise the company and its virtues but rather to talk about the recent company performance and provide an outlook. Hence it is likely to be less impacted by ‘PR’ talk and hopefully the language used more accurately reflect the culture of the company.
Data analysis
We look firstly at some of the basic data analysis. We can see in Figure 1 below that total mentions of culture within conference calls have increased over time.
Figure 1: Total mentions of culture words in transcripts over time
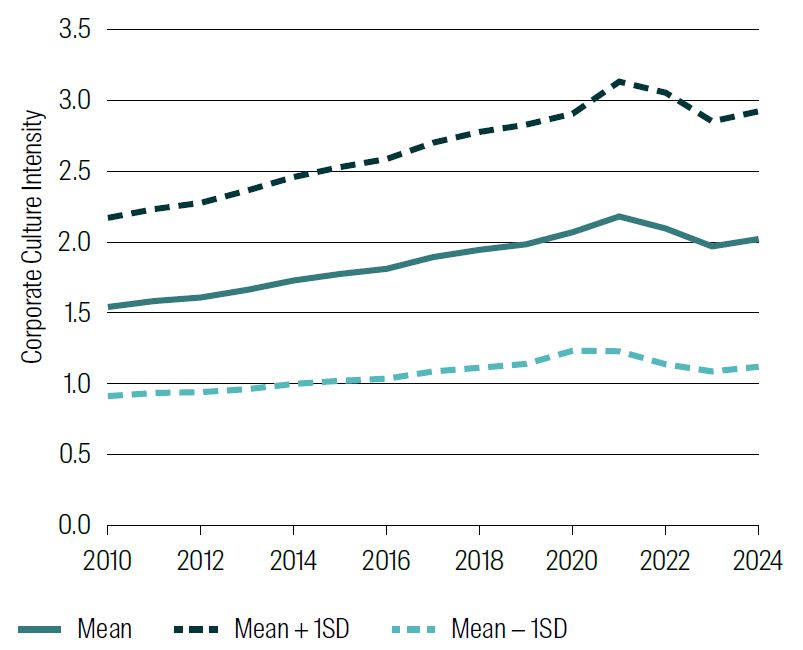
Source: RQI, Factset, Data as at 30 June 2024
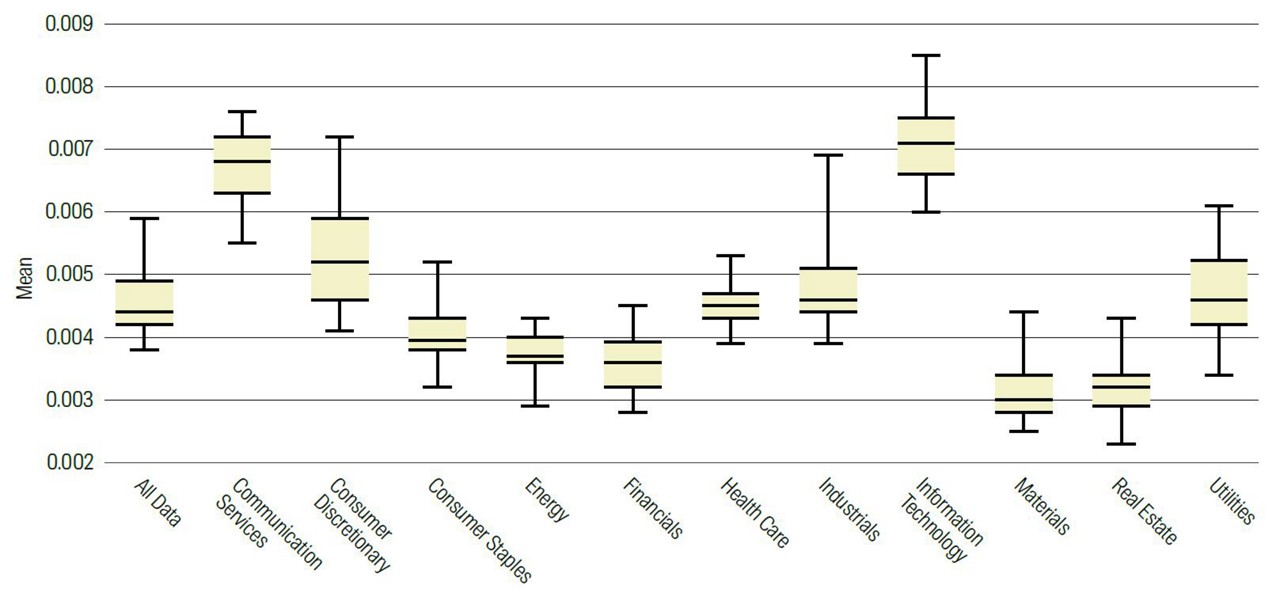
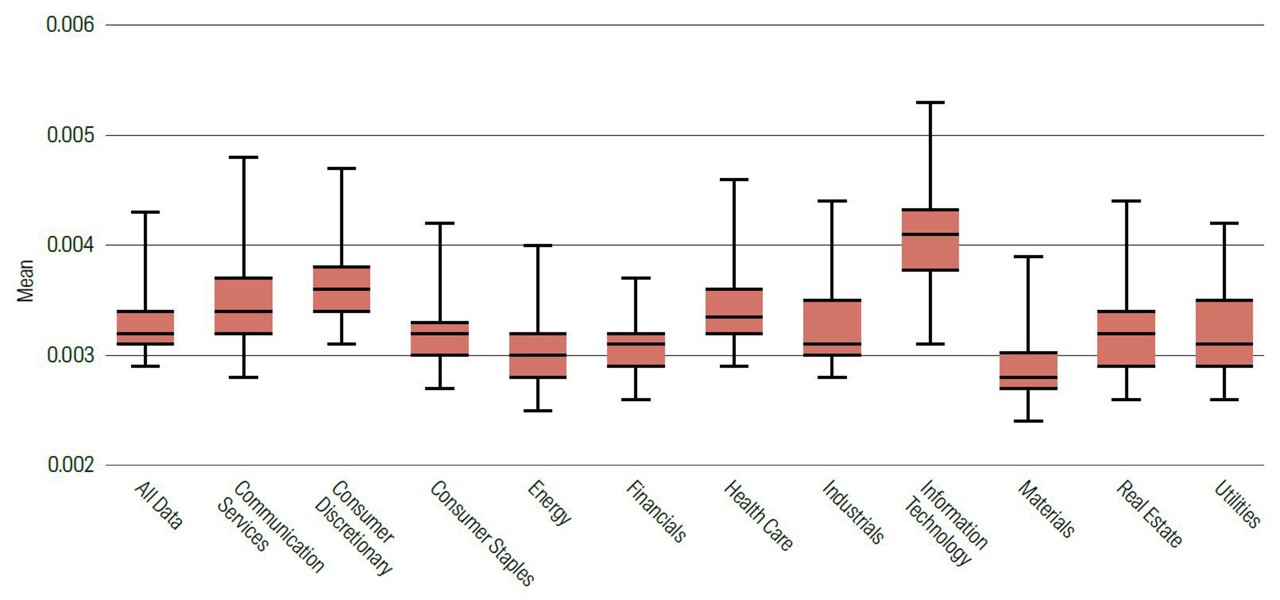
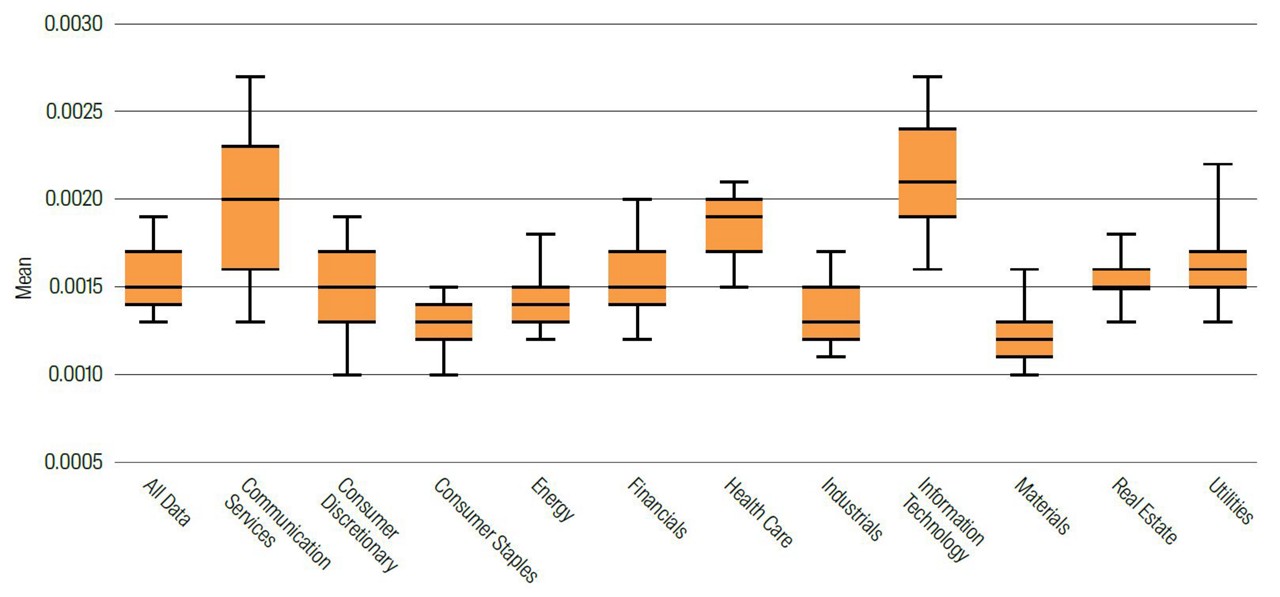
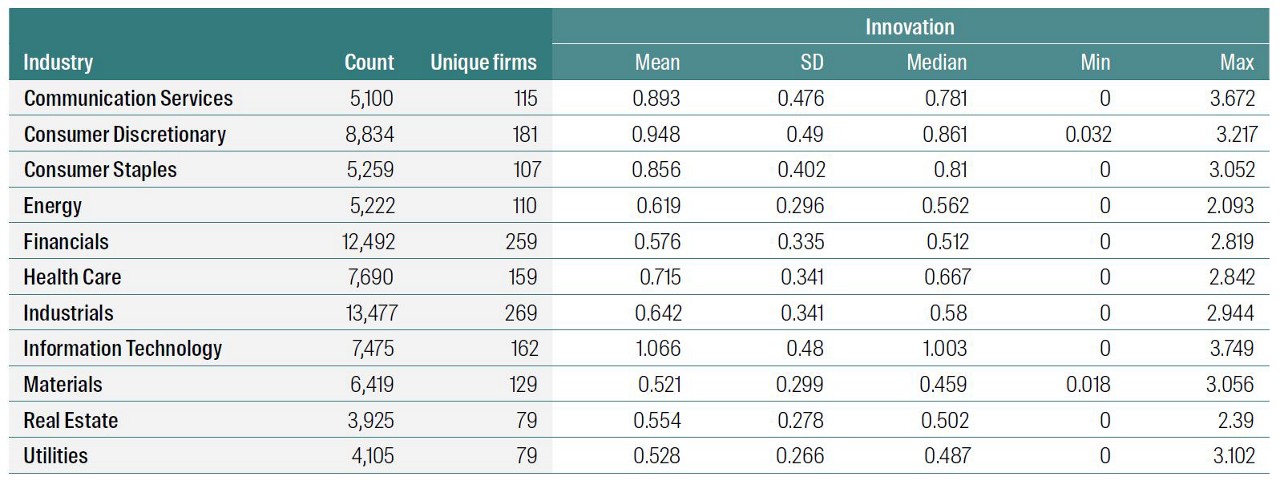
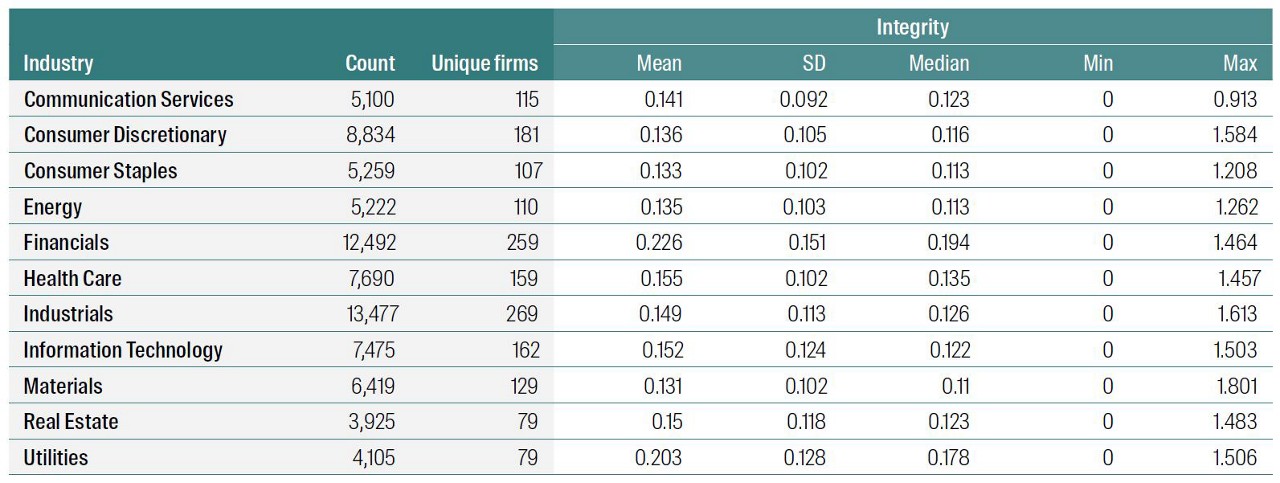
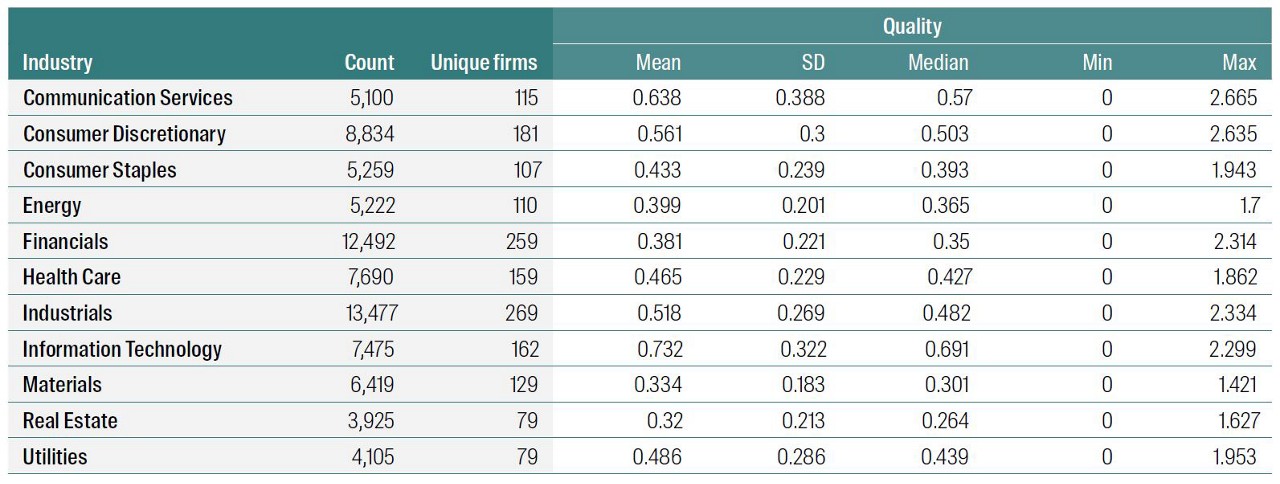
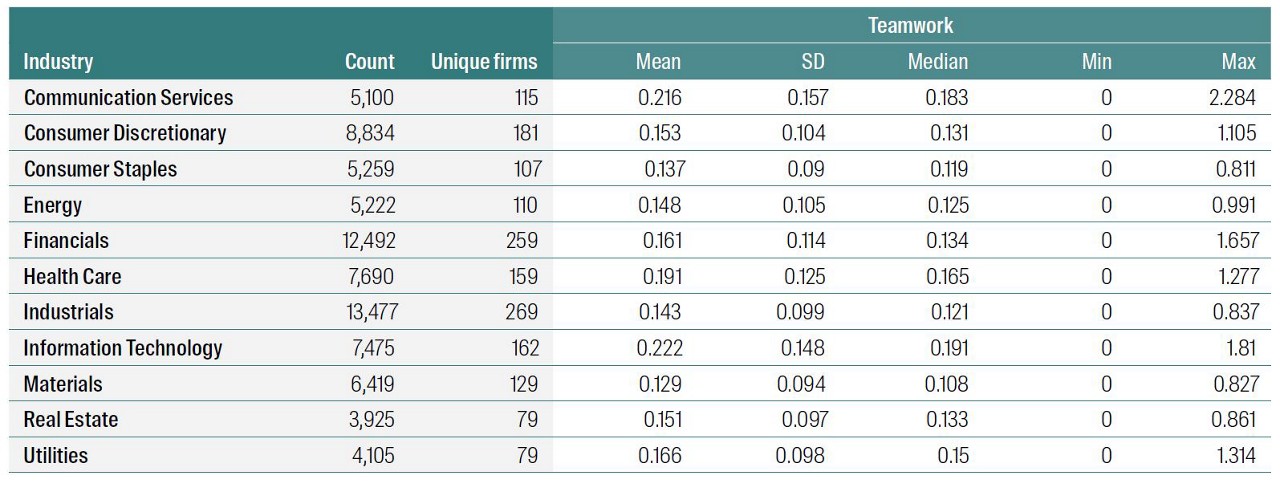
We can go further. When we look at the five underlying corporate values, we can also see that different industries have a focus on different corporate value. This is not surprising. For example, IT firms and communication services have more mentions of innovation but financials talk more about integrity (probably to address previous issues!). The distribution of mentions by sector for the five corporate values are in Figures 2 to 6 below. These charts show the distribution of the mentions with the box representing where the middle 50% (also known as the interquartile spread) of the mentions lies.
Figure 2: Distribution of Innovation words by industry
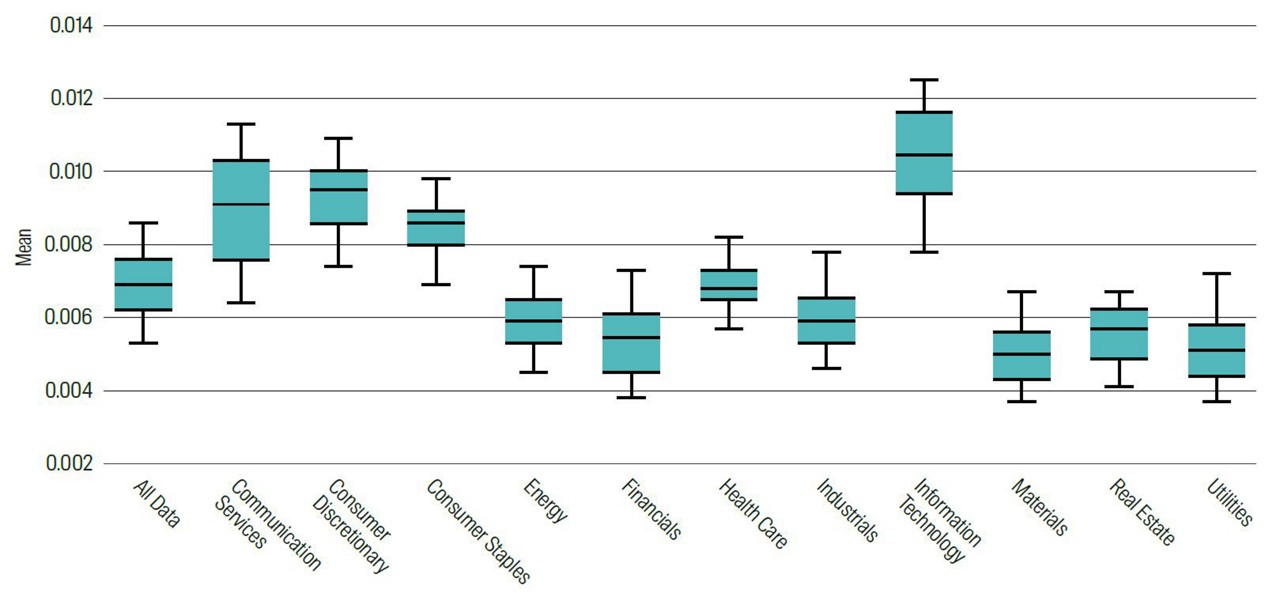
Source: RQI, Factset, Data as at 30 June 2024
Figure 3: Distribution of Integrity words by industry
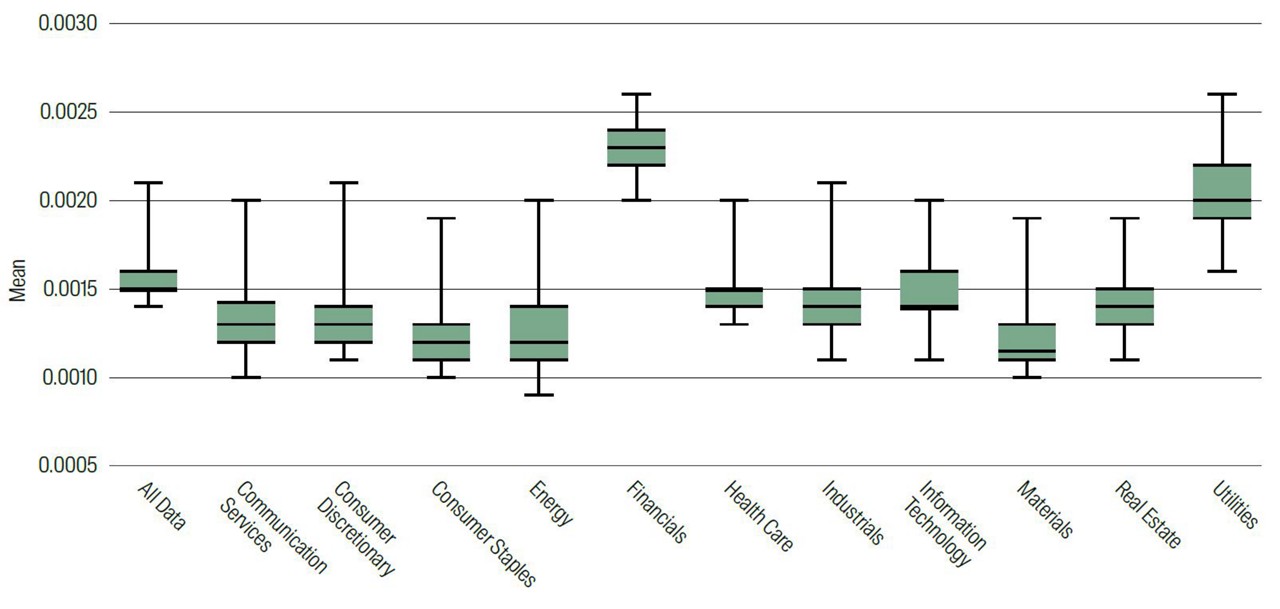
Source: RQI, Factset, Data as at 30 June 2024
Figure 4: Distribution of Quality words by industry
Source: RQI, Factset, Data as at 30 June 2024
Figure 5: Distribution of Respect words by industry
Source: RQI, Factset, Data as at 30 June 2024
Figure 6: Distribution of Teamwork words by industry
Source: RQI, Factset, Data as at 30 June 2024
We go further to provide some descriptive statistics for each sector – both at the overall level as well as split out between the five different corporate values. See Table 1 below. What is interesting is that it is only the value ‘respect’ that is mentioned across all firms over time. For other values (e.g., integrity, teamwork and quality), there are at least some firms within the sectors that do not mention any of the words associated with the value in the conference call (as shown by the score of 0 for the min value).
Table 1: Descriptive statistics of Corporate Value words
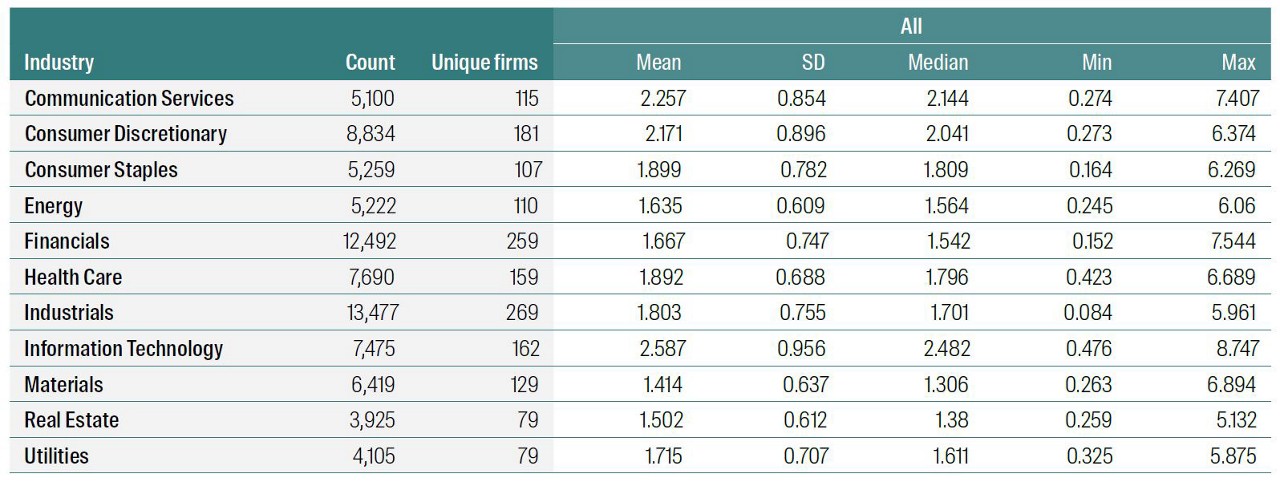

Source: RQI, Factset, Data as at 30 June 2024
Determining the strength of Corporate Culture
We are interested in determining the strength of the corporate culture within the firm. To this end we look at the different parts of the conference call to see the consistency of the language used by the company.
A conference call transcript is split into two main sections – the prepared management section, where the company provides their initial comment, and then the analyst Q&A section where the analyst can ask questions of management without notice. We expect differences in the way management may talk in these sections will show up if culture is not truly embedded in the firm, and it is these differences may give us a better insight into the underlying culture of the company.
Even though the focus of the conference call is on providing an update on the earnings of the company, we have seen that the prepared section of these conference calls is often very structured and more in ‘PR’ talk. Hence there is some chance that it has been manipulated and may not give us the best measure of the company culture. However, when management must answer questions from analysts, these are off-the-cuff, and therefore give a better reflection of the way management actually speak. We therefore look at the difference in the language between the different parts of the conference call to give us a measure of the strength of the company culture.
The higher the score, the stronger the corporate culture is embedded in the firm. That is, if the culture is truly embedded in the company, then the way management speaks whether it is prepared or off the cuff should be similar (i.e., they not only “talk the talk” but also “walk the walk”). If it is not truly embedded and has just been more for show, we would expect to see differences in the culture score between the two sections. Further, if we see a strong score in the analyst section and not the prepared section, we also view this as positive as the management appear to have this language embedded in their company and do not feel the need to emphasis it in the prepared section. In other words, for them it is just the way business is done.
We also don’t just look at the analyst’s section (and ignore the management section) as this doesn’t allow us any comparison – the comparison is important. If a company scores poorly on culture in the analyst section, we won’t know if that is because they don’t care about culture (and score poorly in the prepared section as well) or if they are trying to pretend they have a good culture and hence score well in the prepared section and poorly in the analyst section.2 We want to be able to distinguish between these two situations where we believe the second option is worse than the indifference shown under the first scenario.
Analysis
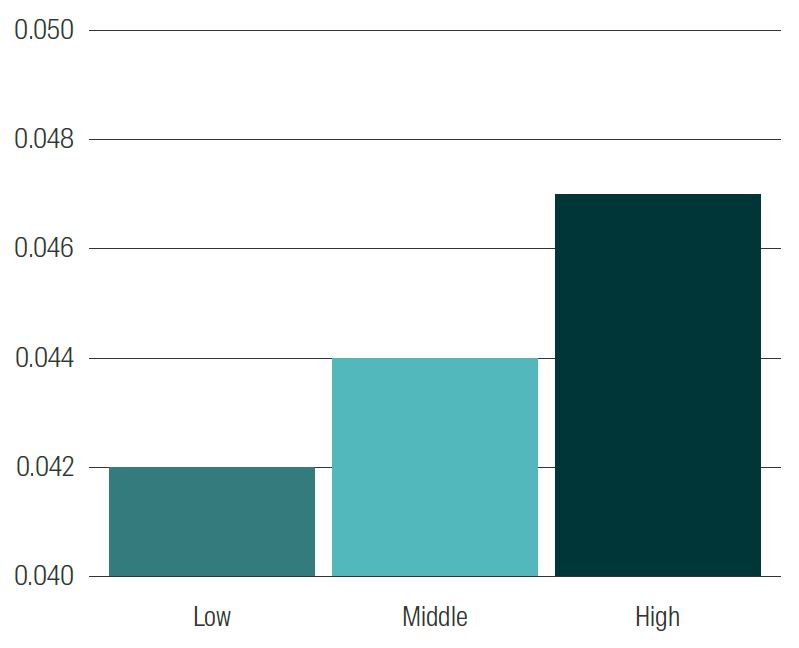
Having determined a way to measure culture we look at the attributes it reflects of the company. We would hope that companies with better culture would also be better managed firms and hence be of higher quality. We would also expect them to be less risky and volatile for the same reason. We looked to see if this is the case in our data set. We split the companies into three groups, those with low, middle and high culture scores and looked at the average return on assets (ROA) as a proxy for quality and volatility as a proxy for risk. We can see the results in Figure 7 below.
We see that as the score for culture increases, the ROA for the firms on average also increase. This showing that firms with better culture tend to be better quality firms.
Figure 7: Average ROA of firms split by Corporate Culture score
Source: RQI Data as at 30 June 2024
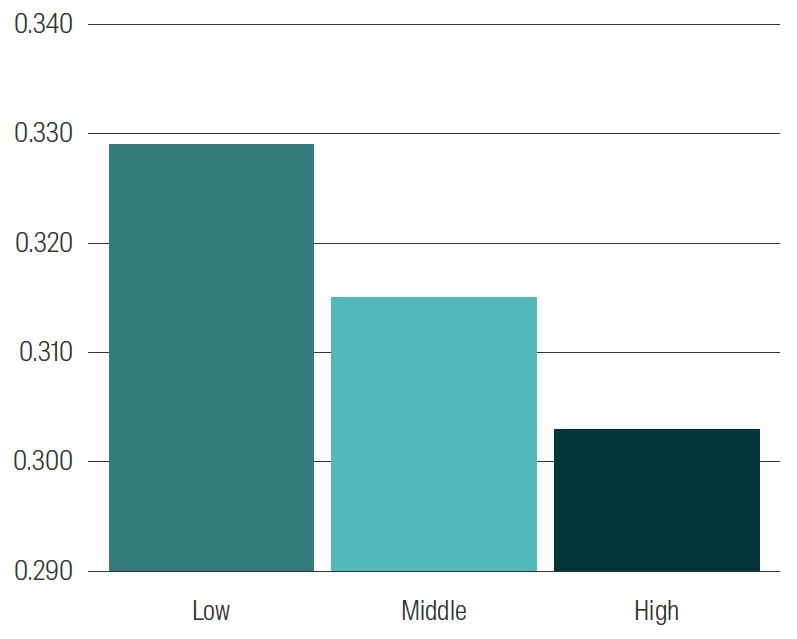
Figure 8 : Average Volatility of firms split by Corporate Culture score
Source: RQI Data as at 30 June 2024
We also looked at the volatility of the firm in Figure 8. Here we see that as the culture score increases, the volatility of the firm reduces showing that firms with better culture are also lower risk.
What about trading on this idea?
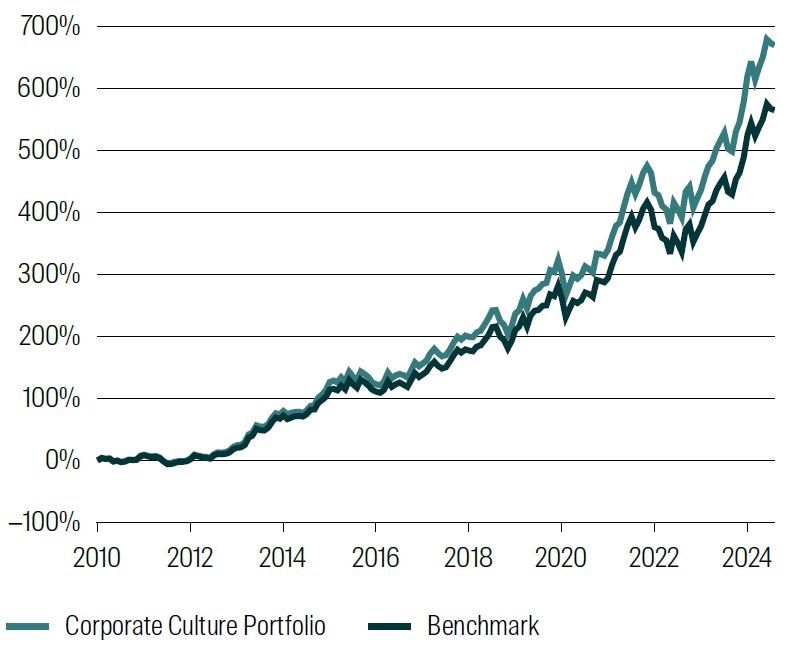
Having seen that there is a link between corporate culture and different attributes of the firm (quality and risk) we wanted to see if this information is considered in the market. We constructed an optimised portfolio that tilts towards firms which exhibit strong culture and away from those with weaker culture. As we are using English-translated conference calls, our universe includes only those stocks within the MSCI ACWI universe that trade in North American or European markets3. This is approx. 1000 stocks within the universe of MSCI ACWI, which covers approx. 80% of the market cap.
We see the performance of this backtested portfolio relative to the benchmark in Figure 9 below.
Figure 9: Backtest performance of Long Short portfolio
Source: RQI Data as at 30 June 2024
Over the nearly 14 year period we can see that the corporate culture tilted portfolio has outperformed the benchmark. This consistency in performance over this period shows that this firm attribute of strong corporate culture is one that is rewarded by the market. This performance is just over 1% return p.a over the approx. 14-year period.
Conclusion
We have found a compelling way to be able to capture the corporate culture of a firm. This uses natural language processing via a curated dictionary to see the importance of common corporate values words within conference call transcripts. We analyse the difference in the prepared section of the conference call verses the analyst Q and A section to see if companies not only “talk the talk” but also “walk the walk”. We find strong performance with this insight, both in terms of quality and risk but also in terms of outperformance relative to the market.
RQI Investors
We combine powerful quantitative analysis with human insight, aiming to deliver strong investment performance
Our proprietary quantitative equities approach is founded on proven data combined with the disciplined application of meaningful economic fundamentals that aims to enhance investment performance.
1 O’Reilly, 1989; O’Reilly and Chat- man, 1996
2 “The most important thing is sincerity/honesty – If you can fake that you’ve got it made”. Variously attributed to George Burns, Groucho Marx and others
3 As we currently only have English conference call transcripts and hence limited coverage in Asia and the Emerging markets
Read our latest insights
Important Information
This material is for general information purposes only. It does not constitute investment or financial advice and does not take into account any specific investment objectives, financial situation or needs. This is not an offer to provide asset management services, is not a recommendation or an offer or solicitation to buy, hold or sell any security or to execute any agreement for portfolio management or investment advisory services and this material has not been prepared in connection with any such offer. Before making any investment decision you should conduct your own due diligence and consider your individual investment needs, objectives and financial situation and read the relevant offering documents for details including the risk factors disclosure. Any person who acts upon, or changes their investment position in reliance on, the information contained in these materials does so entirely at their own risk.
We have taken reasonable care to ensure that this material is accurate, current, and complete and fit for its intended purpose and audience as at the date of publication. No assurance is given or liability accepted regarding the accuracy, validity or completeness of this material.
To the extent this material contains any expression of opinion or forward-looking statements, such opinions and statements are based on assumptions, matters and sources believed to be true and reliable at the time of publication only. This material reflects the views of the individual writers only. Those views may change, may not prove to be valid and may not reflect the views of everyone at First Sentier Investors.
Past performance is not indicative of future performance. All investment involves risks and the value of investments and the income from them may go down as well as up and you may not get back your original investment. Actual outcomes or results may differ materially from those discussed. Readers must not place undue reliance on forward-looking statements as there is no certainty that conditions current at the time of publication will continue.
References to specific securities (if any) are included for the purpose of illustration only and should not be construed as a recommendation to buy or sell the same. Any securities referenced may or may not form part of the holdings of First Sentier Investors’ portfolios at a certain point in time, and the holdings may change over time.
References to comparative benchmarks or indices (if any) are for illustrative and comparison purposes only, may not be available for direct investment, are unmanaged, assume reinvestment of income, and have limitations when used for comparison or other purposes because they may have volatility, credit, or other material characteristics (such as number and types of securities) that are different from the funds managed by First Sentier Investors.
Selling restrictions
Not all First Sentier Investors products are available in all jurisdictions.
This material is neither directed at nor intended to be accessed by persons resident in, or citizens of any country, or types or categories of individual where to allow such access would be unlawful or where it would require any registration, filing, application for any licence or approval or other steps to be taken by First Sentier Investors in order to comply with local laws or regulatory requirements in such country.
This material is intended for ‘professional clients’ (as defined by the UK Financial Conduct Authority, or under MiFID II), ‘wholesale clients’ (as defined under the Corporations Act 2001 (Cth) or Financial Markets Conduct Act 2013 (New Zealand) and ‘professional’ and ‘institutional’ investors as may be defined in the jurisdiction in which the material is received, including Hong Kong, Singapore, Japan, and the United States, and should not be relied upon by or be passed to other persons.
The First Sentier Investors funds referenced in these materials are not registered for sale in the United States and this document is not an offer for sale of funds to US persons (as such term is used in Regulation S promulgated under the 1933 Act). Fund-specific information has been provided to illustrate First Sentier Investors’ expertise in the strategy. Differences between fund-specific constraints or fees and those of a similarly managed mandate would affect performance results.
About First Sentier Investors
References to ‘we’, ‘us’ or ‘our’ are references to First Sentier Investors, a global asset management business which is ultimately owned by Mitsubishi UFJ Financial Group (MUFG). Certain of our investment teams operate under the trading names AlbaCore Capital Group, FSSA Investment Managers, Stewart Investors and RQI Investors all of which are part of the First Sentier Investors group.
This material may not be copied or reproduced in whole or in part, and in any form or by any means circulated without the prior written consent of First Sentier Investors.
We communicate and conduct business through different legal entities in different locations. This material is communicated in:
- Australia and New Zealand by First Sentier Investors (Australia) IM Ltd, authorised and regulated in Australia by the Australian Securities and Investments Commission (AFSL 289017; ABN 89 114 194311)
- European Economic Area by First Sentier Investors (Ireland) Limited, authorised and regulated in Ireland by the Central Bank of Ireland (CBI reg no. C182306; reg office 70 Sir John Rogerson’s Quay, Dublin 2, Ireland; reg company no. 629188)
- Hong Kong by First Sentier Investors (Hong Kong) Limited and has not been reviewed by the Securities & Futures Commission in Hong Kong. First Sentier Investors, FSSA Investment Managers, Stewart Investors, RQI Investors and Igneo Infrastructure Partners are the business names of First Sentier Investors (Hong Kong) Limited.
- Singapore by First Sentier Investors (Singapore) (reg company no. 196900420D) and this advertisement or material has not been reviewed by the Monetary Authority of Singapore. First Sentier Investors (registration number 53236800B), FSSA Investment Managers (registration number 53314080C), Stewart Investors (registration number 53310114W), RQI Investors (registration number 53472532E) and Igneo Infrastructure Partners (registration number 53447928J) are the business divisions of First Sentier Investors (Singapore).
- United Kingdom by First Sentier Investors (UK) Funds Limited, authorised and regulated by the Financial Conduct Authority (reg. no. 2294743; reg office Finsbury Circus House, 15 Finsbury Circus, London EC2M 7EB)
- United States by First Sentier Investors (US) LLC, authorised and regulated by the Securities Exchange Commission (RIA 801-93167).
- other jurisdictions, where this document may lawfully be issued, by First Sentier Investors International IM Limited, authorised and regulated in the UK by the Financial Conduct Authority (FCA ref no. 122512; Registered office: 23 St. Andrew Square, Edinburgh, EH2 1BB; Company no. SC079063).
To the extent permitted by law, MUFG and its subsidiaries are not liable for any loss or damage as a result of reliance on any statement or information contained in this document. Neither MUFG nor any of its subsidiaries guarantee the performance of any investment products referred to in this document or the repayment of capital. Any investments referred to are not deposits or other liabilities of MUFG or its subsidiaries, and are subject to investment risk, including loss of income and capital invested.
© First Sentier Investors Group
