
Emerging Markets investors have been surprised by the growing dominance of China tech which has brought about increased imbalance. This trend will likely continue which will lead to growing concentration risk as well.
Key Highlights
- The growing dominance of China tech1 (e.g. Alibaba is 8% of the index) has brought increased imbalance in the Emerging Markets (EM) Index.
- This has crept up on passive EM investors in recent years. This is driven by both changes in the MSCI index inclusion rules and the phenomenal underlying performance of China tech companies.
- Chinese tech-related companies continue to lead the global IPO rush, suggesting that this trend will likely continue.
- The rise of China tech has also pushed aggregate valuations higher in the broad index.
- We see growing concentration risk in the passive index, where the top 5 stocks now occupy > 40% of the weight. We believe, this highlights the inherent weakness of market capitalization indices.
- We argue that accounting weighted portfolios (such as Realindex's core EM portfolio) may offer lower concentration risk when compared to its market capitalization counterpart.
Introduction
In late 2019, an article by the state-run media, China Daily, reported that Alibaba Group was named "China's top internet company of the year" by China's Ministry of Industry and Information Technology. The report claimed that China's internet firms have generated over 80,000 patents and have spent 153.87bn yuan in R&D expenditure in 2018 with a > 45% YoY increase. According to US market intelligence firm, CB Insights, one in three tech "unicorns" are born in China. Adding to this, increasing tensions with the US, including the Huawei-Google ban, has perhaps highlighted weaknesses in China's technological supply chain and further strengthened its government's resolve in supporting its tech sector to rival that of the US. This dichotomy of "China tech" vs "US tech", or Shenzhen vs Silicon Valley, is becoming very real. In light of geopolitical tensions, with support from the Chinese government, and buoyed by a vast and expanding urban customer base, China's tech sector is booming. This is having an effect on MSCI EM's market cap weighted index.
In this short note, we show that like US tech in Developed Markets, a select few Chinese internet behemoths have become increasingly dominant in the Emerging Market cap-weighted index. We highlight that passive investors are perhaps unwittingly exposed, not only to the domestic Chinese market, but also to a select few internet companies. For instance, Alibaba alone has more than an 8% weight in MSCI EM, with a 9% marginal contribution to total risk2.Potential upcoming Chinese tech-related IPOs, such as Didi Chuxing (China’s Uber) and Lufax (fintech) indicates that this “China tech” trend in EM is set to continue. This increase in exposure and concentration has added risks. The recent abrupt suspension of Jack Ma’s US$35bn Ant Financial (fintech) IPO in Hong Kong only serves to highlight the regulatory risks of investing in China.
China's path and global role remains unclear. In recent years, it has become increasingly volatile, with domestic, geopolitical and trade tensions. Hawkish sentiment towards China in the US is bipartisan, and we should be expecting to see further friction and diplomatic brinkmanship. These potential left-tail events may lead to significant and unforeseen market regime changes where passive EM investors may be unknowingly at risk. We think it may be important for investors to start thinking more proactively about China, and be open to seeing it as a separate region from the rest of EM.
We are not attempting to forecast or theorize a China play here. Rather, we simply document the growing dominance of Chinese tech exposure in Emerging Markets. We ask readers to be cognizant of this when they invest in market cap weighted EM indices, as the rise and inclusion of these firms has brought about an unprecedented level of imbalance and concentration risk. Furthermore, we show that alternative weighting schemes can alleviate some of these concerns.
The Rise of China
Three key markets dominate the MSCI Emerging Market index, namely China, South Korea and Taiwan. This is shown quite clearly in Figure 1. Whilst both Korea and Taiwan's share of the index has remained largely stable at the 10% level, we have seen phenomenal growth in China's share of the index, from sub 10% in the early 2000s to above 40% currently. This means the current MSCI EM index has over 65% weight in the three East Asian countries combined.
Figure 1: The Rise of China (MSCI EM has become predominantly East Asian)
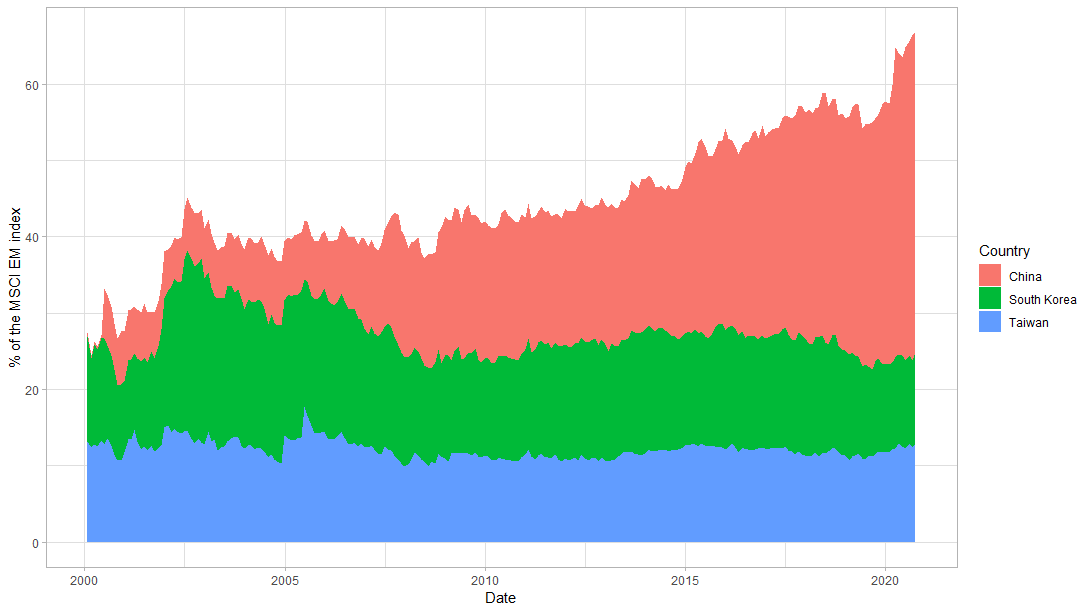
Source: Realindex, MSCI. Data as at 30 September 2020
Historically, investors have questioned whether South Korea could be classified as an emerging market. In September 2009, FTSE had re-categorized Korea from emerging to developed status. This has not occurred for MSCI. If one entertained the removal of South Korea from EM, the dominance of China would be even further magnified.
To further drill down, we decompose this phenomenon by sectors and examine both the weight and the risk contribution of these three East Asian markets. Figure 2 documents the weight contribution and in Figure 3, we show the percentage risk contribution of Chinese, Korean and Taiwanese firms in the MSCI EM index using Axioma's EM4 fundamental risk model3. Greater than 40% of total risk comes from China, of which Communication Services and Consumer Discretionary forms the lion's share of the contribution.
This rise in weight and risk contribution is driven in part by MSCI's index changes in 2015 with Chinese American Depository Receipts (ADRs) and in early 2019 with the introduction of more China A shares exposure. MSCI has highlighted that further A share inclusion is likely given improving market accessibility. It is also driven by the incredible growth in a selection of Chinese tech companies which we will discuss below in more detail.
Figure 2. The Percentage Weight of China, South Korea and Taiwan Firms in the MSCI EM index
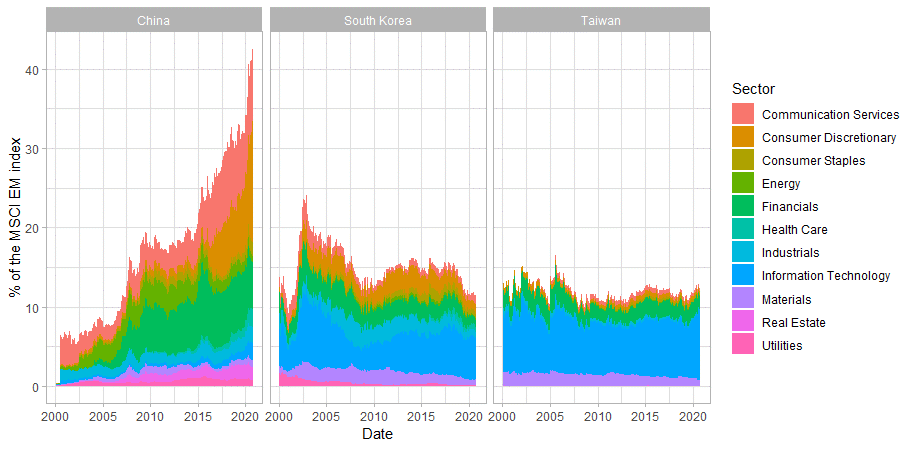
Source: Realindex, MSCI. Data as at 30 September 2020.
Figure 3. The Percentage Risk Contribution of China, South Korea and Taiwan Firms in the MSCI EM index
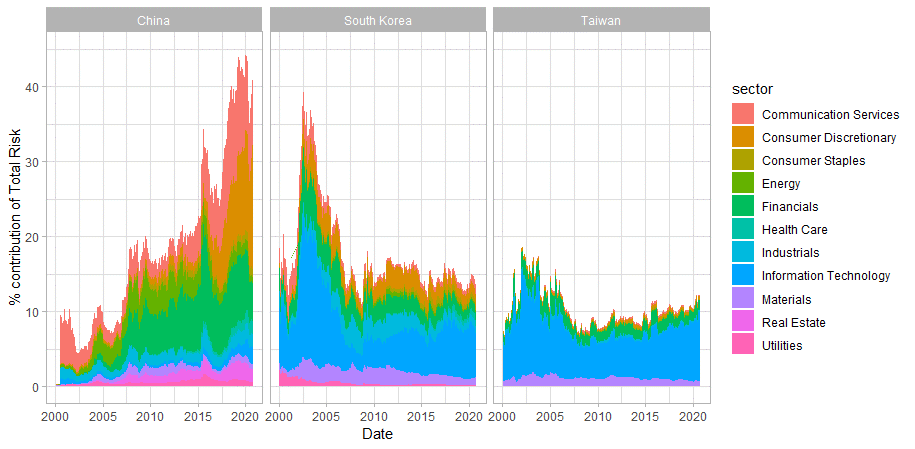
Source: Realindex, MSCI, Axioma. Data as at 30 September 2020.
Alibaba and Tencent are the primary drivers for this meteoric rise...
We note that the lion's share of China's growth is driven by "internet and technology stocks". These are stocks in classified in Consumer Discretionary or Communication Services; such as Alibaba and Tencent. Whilst they might not be traditionally classified as Information Technology, as we are used to seeing with Samsung in South Korea and TSMC in Taiwan, they are indeed "e-commerce and internet technology" firms.
Figure 4. The Weight and Risk Contribution of "China Tech"
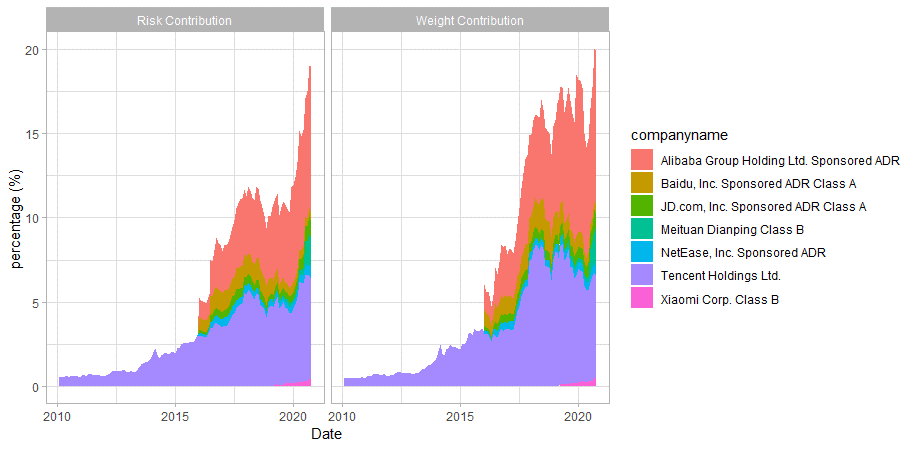
Source: Realindex, MSCI, Axioma. Data as at 30 September 2020.
We see a phenomenal increase in risk contribution from Chinese internet firms, from less than 1% in 2010 to greater than 15% in 2020.
This is largely a reflection of two things. Firstly, the introduction of Chinese ADRs by MSCI in December of 2015. This included the addition of Alibaba Group and Baidu. Secondly, since 2015 many of these Chinese internet firms, with exception of Baidu, has done remarkably well. For example, Alibaba, Tencent, NetRase, Meituan and JD.com have all at least tripled in accumulated returns in the last five years.
Furthermore, we note that as at 30 September 2020 eight out of the top fifteen stocks in the MSCI EM index are now Chinese firms. The top 3 Chinese firms, Alibaba, Tencent and Meituan all belong within this "internet technology" thematic. These firms, along with JD.com and NetEase, have an e-commerce and social media slant, leveraging off China's vast and growing middle class for revenue, and admittedly extra tailwinds following the Covid19 pandemic. This mirrors what we are seeing in Developed Markets, where US tech giants (such as Apple, Amazon, NVIDIA) have dominated the market cap index, and the post-Covid recovery.
Figure 5. Top 15 Stocks in MSCI EM
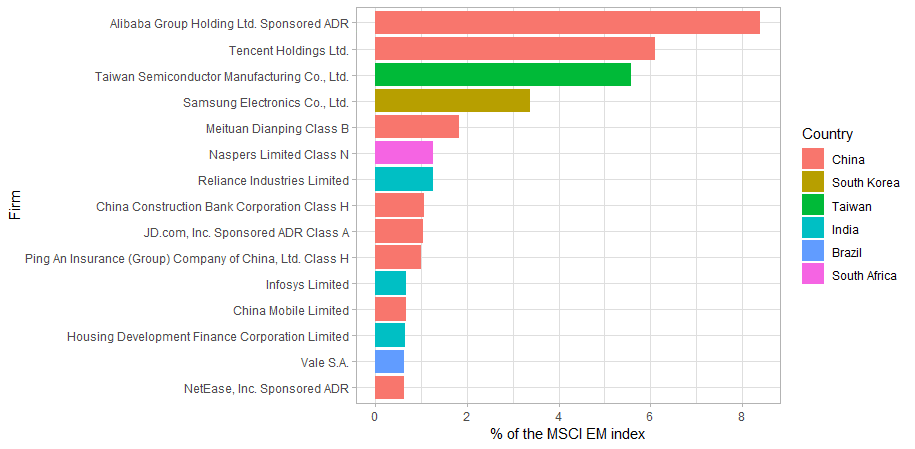
Source: Realindex, MSCI. Data as at 30 September 2020.
Concentration Risk has Significantly Increased
Given the substantial increase in China exposure, we inevitably find the concentration risk in the MSCI EM index has increased dramatically. Figure 6 plots the weight of the top 1, 3 and 5 stocks of the index (left panel). We find that the top 5 stocks have increased to be over 25% of the EM index. In appendix A4, we further decompose concentration risk by sector and show that the recent rise of Alibaba and Tencent has caused an increase in concentration for Communication Services and Consumer Discretionary sectors.
We illustrate that alternative weighting schemes could reduce this level of concentration risk. The panel on the right shows the same for Realindex's EM accounting-weighted portfolio. Realindex's accounting-weighted portfolio is an alternatively weighted smart beta portfolio using four key accounting metrics, Sales, Book Value, Cashflows and Dividends.
The construction methodology does not employ share price (or market capitalization) in the determination of weights, but rather a firm's economic footprint, i.e. the weights are proportional to the sales, dividends, cash flow and book value contribution within the overall investment universe. By doing this we remove forward-looking investor optimism and focus purely on actual economic outcomes. Furthermore, due to our unique construction methodology, we do not see an increase in concentration risk for EM with Realindex's alternative weighted portfolio.
Figure 6 illustrates the weakness of market cap weighted indices, where unprecedented growth in Chinese tech has caused a significant level of portfolio imbalance. By comparison, Realindex is relatively immune to this.
Figure 6. The Combined Weight of the Top n stocks
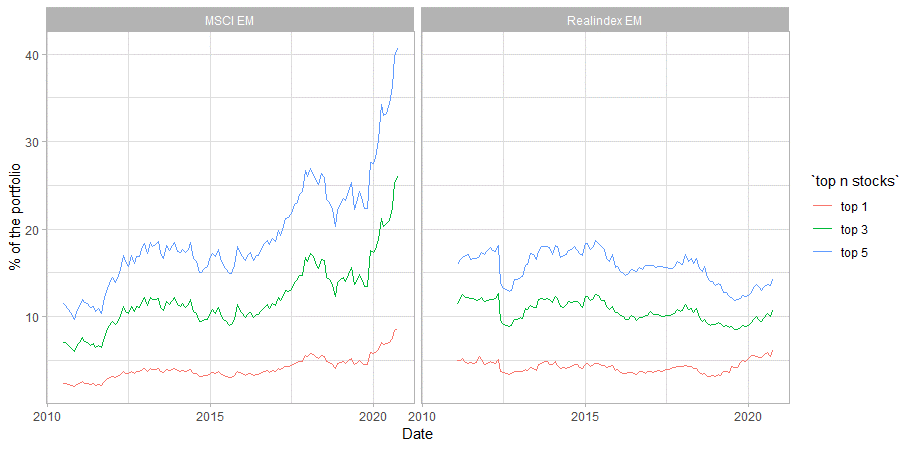
Source: Realindex, MSCI. Data as at 30 September 2020.
Higher Valuations in 'China Tech'
Chinese tech valuations have been buoyed by Covid restrictions. These valuations do not appear to be sensitive to worsening US-China trade relations. For instance, the revenue decomposition of China's three biggest firms in the MSCI EM index are predominately domestic (i.e., comfortably above 85%).
In Figure 7 we plot Dividend Yield, Price-to-Book and Price-to-Earnings for "China Tech", Chinese companies ex "China Tech" and the rest of the EM. These are value-weighted valuations. "China Tech" refers to the following names, Alibaba, Tencent, Baidu, JD.com, Meituan, NetEase and Xiaomi, i.e. those firms illustrated in Figure 4. It is clear that "China Tech" is significantly more expensive that the rest of the market, trading at a P/E ratio of circa 40x over time. "China Tech" also has significantly lower dividend yields.
Figure 7. Valuations in EM over time
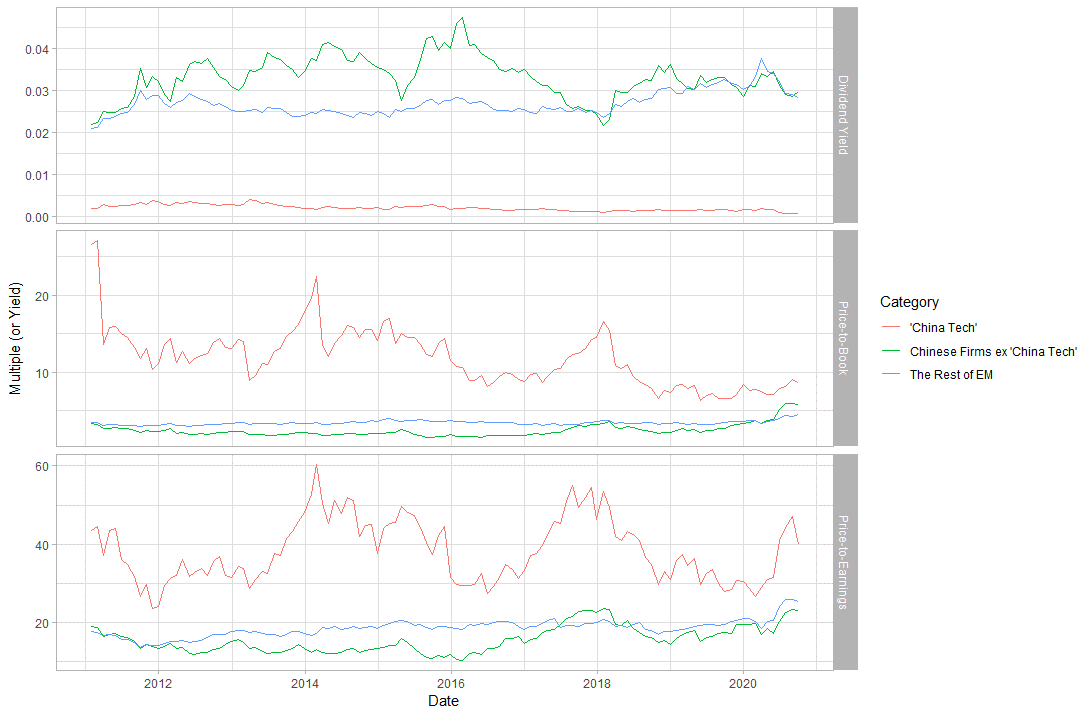
Source: Realindex, MSCI. Data as at 30 September 2020.
The recent strength in "China tech" names have stretched EM valuations. The percentage of the MSCI EM index in expensive stocks (Quintile Q5 in Figure 8) have increased over the last 5 years. Therefore, as a whole, the market capitalization index has become 'pricier'. We find the rapid acceleration of the index weight in expensive 'glamour' stocks (as defined by Price-to-Book quintiles) to be concerning.
Figure 8. The Percentage of MSCI EM Index in Price-to-Book quintiles over time
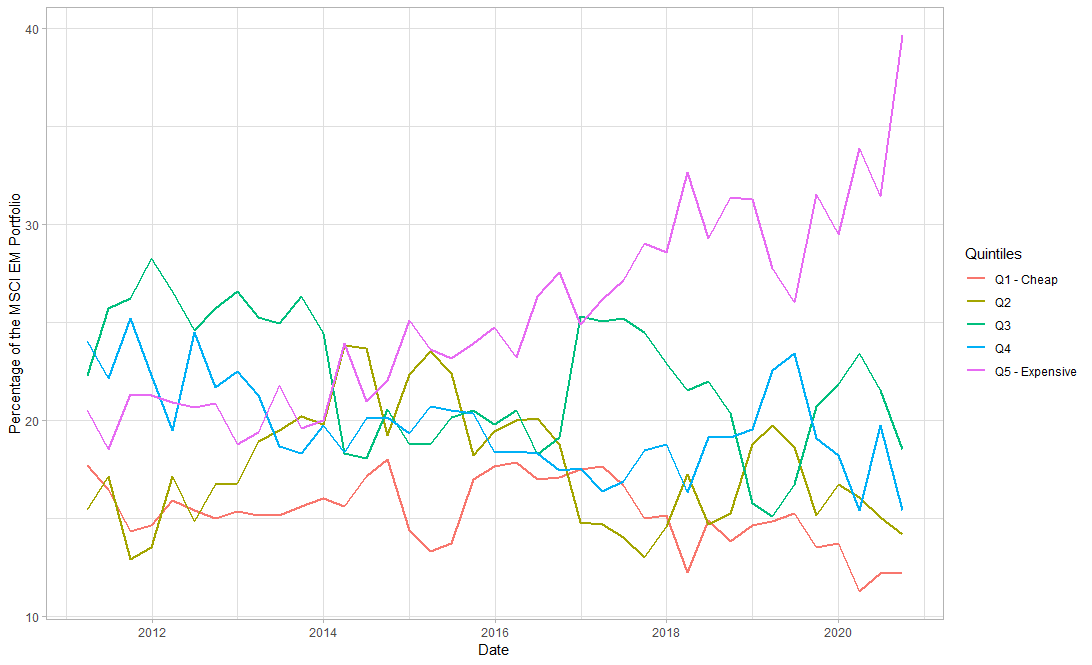
Source: Realindex, MSCI. Data as at 30 September 2020.
Conclusions
The rise of Chinese tech firms has brought about imbalances to the market cap weighted index for emerging markets. This has been largely driven by Alibaba and Tencent, where the former has more than 8% weight in MSCI EM. We expect to see this trend continue with the potential Ant Financial and Didi Chuxing IPOs into Hong Kong. Therefore, it is possible that China's risk contribution to MSCI EM could well be over 50% in the near future, with even greater concentration risk to "tech" names.
We urge passive EM investors to be aware of these risk exposures, and show that alternative weightings can alleviate some of these concerns.
Appendix
A1. Key Contributions to Risk in MSCI EM
Here we document the individual contributions to total risk of the MSCI EM index portfolio. The aggregate contribution to risk by Chinese firms (at > 40%) simply reflect the greater weight in Chinese firms (also at > 40%). We highlight that "Internet& Direct Marketing" now constitutes as the industry with the biggest risk allocation This is performed using the Axioma (Qontigo) EM4 fundamental risk model as at August 2020.
Panel A. At the Stock Level
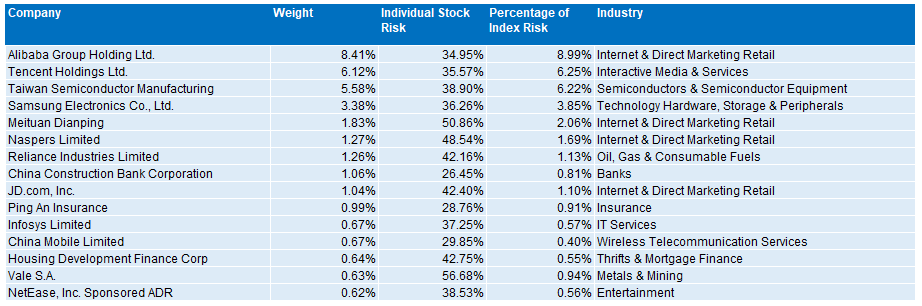
Source: Axioma. Data as at 31 August 2020.
Panel B. At the Industry / Country Level
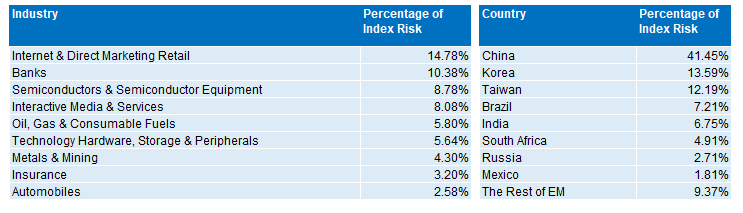
Source: Axioma, Data as at 31 August 2020.
A2. Percentage Contributions to Risk in MSCI EM over Time
In the charts below, we plot the percentage contributions to total EM risk over time. The story on risk contribution largely mirrors that with weights. We see an increasing portion of risk being dominated by Chinese firms.
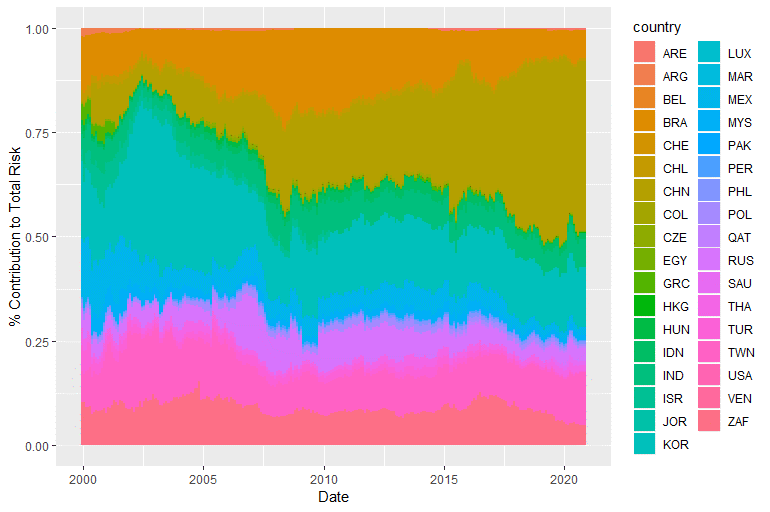
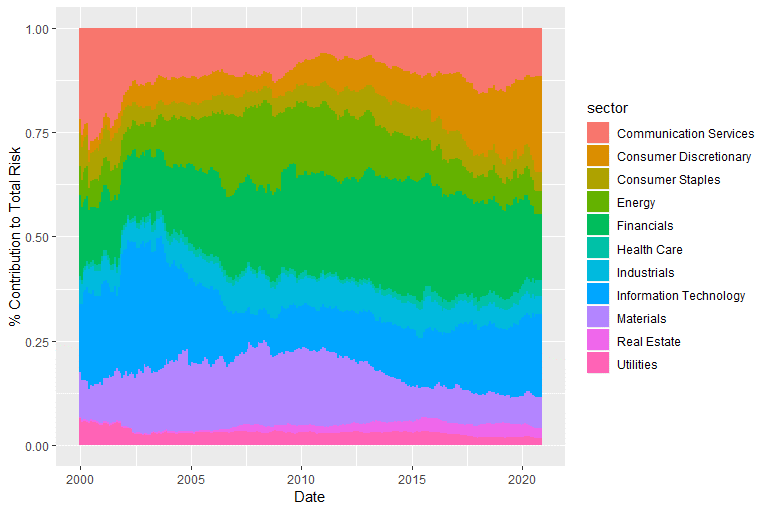
Source: Axioma, Data as at 31 August 2020.
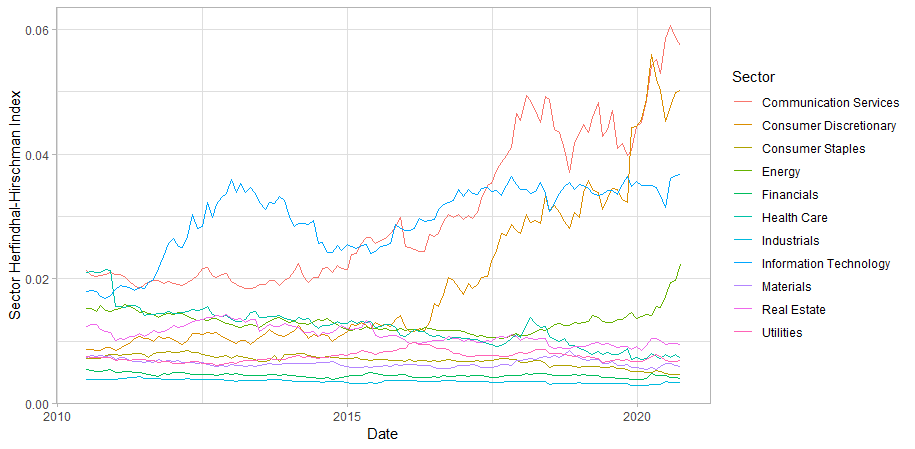
A3. Concentration Risk within sectors
We also dive into sector level concentration risk via the Herfindahl-Hirschman Index4. We find that the concentration risk in Communication Services and Consumer Discretionary have increased significantly over the last 5 years. This corresponds with the rise of Alibaba and Tencent. Concentration risk in IT remain strong and it is largely driven by Samsung and TSMC.
Source: Axioma, Data as at 31 August 2020.
For further information please contact:
| Andrew Francis Chief Executive +61 2 9010 5224 | Iain McLear Investment Manager +61 2 9010 5298 | Bonnie Chow Investment Analyst +61 2 9010 5240 |
1China in this article refers to mainland China, and is consistent with MSCI categorization. It does not refer to greater China.
2Based on Axioma's EM4 fundamental risk model as at 30 September 2020.
3A fundamental risk model decomposes risk using well-understood and researched factors.
4The Herfindahl-Hirschman Index is a measure of the size of firms in relation to the industry and an indicator of the amount of competition among them.
Important Information
This material has been prepared and issued by First Sentier Investors (Australia) IM Ltd (ABN 89 114 194 311, AFSL 289017) (Author). The Author forms part of First Sentier Investors, a global asset management business. First Sentier Investors is ultimately owned by Mitsubishi UFJ Financial Group, Inc (MUFG), a global financial group. A copy of the Financial Services Guide for the Author is available from First Sentier Investors on its website.
This material contains general information only. It is not intended to provide you with financial product advice and does not take into account your objectives, financial situation or needs. Before making an investment decision you should consider, with a financial advisor, whether this information is appropriate in light of your investment needs, objectives and financial situation. Any opinions expressed in this material are the opinions of the Author only and are subject to change without notice. Such opinions are not a recommendation to hold, purchase or sell a particular financial product and may not include all of the information needed to make an investment decision in relation to such a financial product.
To the extent permitted by law, no liability is accepted by MUFG, the Author nor their affiliates for any loss or damage as a result of any reliance on this material. This material contains, or is based upon, information that the Author believes to be accurate and reliable, however neither the Author, MUFG, nor their respective affiliates offer any warranty that it contains no factual errors. No part of this material may be reproduced or transmitted in any form or by any means without the prior written consent of the Author.
