
Is there a problem with zombie firms today? David Walsh, Head of Investments at Realindex Investments explores where the problem of zombie firms is most prevalent and the characteristics of zombie firms using Realindex data.
Figure 1: Zombies Take The Cash
(Our apologies, another silly graphic was needed.1)
In an earlier paper2, we took a close look at the phenomenon of zombie firms that has emerged since the Global Financial Crisis (GFC). There, we discussed the economic implications of this emergence and what it might mean for capital allocation, default provisioning and the long term underperformance of the value style3 among other things. In this paper, we explore the empirical side of this in more detail, using Realindex data, including:
- The trend and distribution of zombie firms
- Size, sector and country characteristics
- The relationship between zombies and various style factors (like value)
We come to three conclusions that add to the debate:
- The zombie firm problem certainly exists but the recent upwards trend is primarily a small and micro-cap effect. Large cap stocks do appear as zombies but do not appear to be increasing in number.
- The definition used for zombie firms matters. We - like others - use a profitability based measure, but this may not apply well everywhere (for example, in Japan) and results can be quite sensitive to assumptions.
- Zombie firms (using our definition) are cheaper than the rest of the universe but also are much lower quality (measured as return on equity (ROE)). This is important to consider when building a value-based investment strategy. Stocks which re-appear (“reanimate”) show improving characteristics but are still cheap and of lower quality than the rest of the universe.
An important note: The aim of our studies here is to assess the proportion of zombie firms in our investable universe of listed equities. That is, we are concerned about our clients’ exposure to firms in this category. Other studies (e.g., Banerjee and Hofmann (2018, 2020)4) look at the economic implications of this effect, and cover a much wider universe of names, including many small caps which would probably not pass an investability test for institutional equity portfolios. We also suspect that is the primary reason for difference between our results and theirs.
Before proceeding, one obvious conclusion - that we actually find here - is that zombie firms will look cheap. Like the usual value-trap problem, this special but possibly growing class stocks may indeed look cheap, and for a very good reason. By tilting towards a value style, an investment manager may inadvertently take on a “zombie” tilt, increasing the risk of default while believing the mean reversion story5 embedded in value investing.
A value investment style (like Realindex’s) needs to take into account this effect through a quality overlay acting as a “zombie-repellent”. The final paper in this series looks at this.
One final consideration has to be the ex-ante prediction of zombie firms. If we can find a way to classify these firms in advance, we can potentially use this in our investment process. Recognizing the zombies when they are out “roaming the streets” is easier than picking the likely candidates. A default prediction model like Altman’s Z-score6 would be a good place to start - again we leave this for a later paper.
Contents
- A Brief History
- Our Data Set
- Defining a Zombie Firm
- Trend and Shape Physical Characteristics of Zombies - size, sector, country
- Style Characteristics of Zombies - value, quality and momentum
- Zombie Migration - back to life and as drivers of the value premium
- Sensitivity to Definition
- Conclusions
A Brief History
The term “zombie firms” was probably coined by Edward Kane in research into the Savings and Loan crisis of the late 1980s7. It has been re-used to examine Japanese corporates in the 1990s (Caballero, Hoshi and Kashyap (2008)(CHK08)8) and now more recently post GFC, with the extreme low interest rates and default forbearance among lending institutions. The COVID crisis has extended these policy settings and the zombie discussion into the present day.
The two charts below were also used in our first paper, and give us our lead for this one.
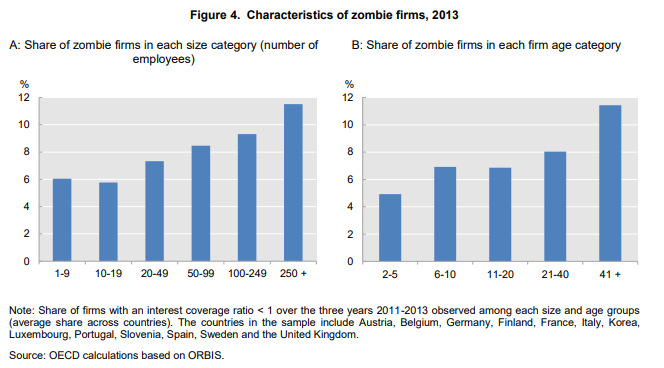
Figure 2: Some Zombie Firm Characteristics
The chart is from Adalet McGowan, Andrews and Millot (2017)9. Defining zombie firms as those which have interest cover below 1 for three consecutive years, they find significant size and age biases - smaller, older firms are much more likely to be zombies.
Extending this, Banerjee and Hofmann (2018)10 show that by further classifying zombies as being older than 10 years and/or having a Tobin’s q (ratio of asset market value to book value) below sector median, the percentage of zombie firms has been increasing steadily for many years. It is now at alarming levels, measured as a percentage of all firms and using their data set. The chart below shows their results.
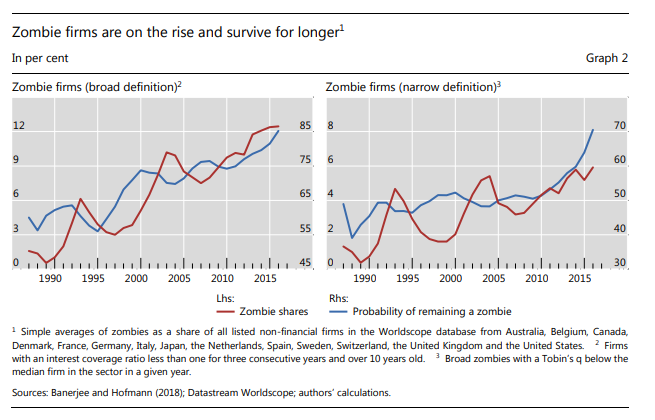
Figure 3: Zombie Firm Growth and Persistence
Our Data Set
Banerjee and Hofmann (2018, 2020)11 use a data set drawn from Worldscope data of all listed companies in 14 advanced countries (including Australia). This yields a set of more than 32,000 separate listed equities since the late 1980s.
Our data set is broader12, in the sense that it covers Developed Markets (24 countries), Emerging Markets (29 countries) and Australia, from 1999 to 2019. However, it does not cover as many names - we concentrate on larger, more investable stocks than Banerjee and Hofmann. The data set in their paper (although not specified) must have a very large number of very small cap stocks.
This apparently very long small cap tail may explain the differences in results we see when compared to their paper.
For example, our Developed Markets universe contains a total of about 13,000 unique stocks, growing from around 4,300 names in 1999 to about 6,500 in 2019. The chart below shows this growth, along with the number of stocks in the largest two developed markets - USA and Japan. For Australia, our data set finishes in 2019 with almost 500 names (and has over 1,050 in total), while the Emerging Markets data set has almost 800 names in 2019 (with more than 10,500 in total).
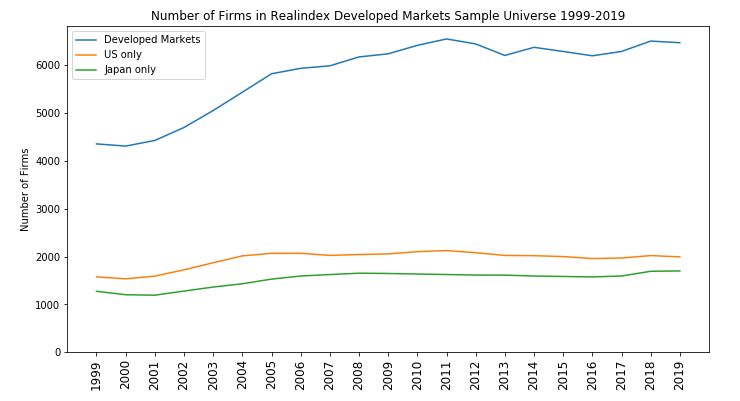
Figure 4: Sample Size Over Time: DM, US and JPN
Source: Realindex, data as at 31 December 2019
Note that unlisted firms are not included in our data set or in those from the other papers. This is not in any way attempting to downplay the importance of unlisted firms - data can be difficult to obtain on these firms, and in our case we are concentrating on listed firms as they are the universe we use for investment of our clients’ funds.
Defining a Zombie Firm
There are many ways to define a zombie firm. Those suggested by Banerjee and Hofmann (2018, 2020) and Adalet McGowan, Andrews and Millot (2017) are profitability-based - that is, they look for a sustained period of reported low interest cover. On top of that, they include firm age and Tobin’s Q (ratio of asset market value to book value):
Method 1: Three consecutive years of interest cover (IC) less than 1. Firm age greater than 10.
Method 2: Method 1 with Tobin’s Q less than sector average.
Method 3: Two consecutive years of IC less than 1. Tobin’s Q less than sector average. (To be declassified as a zombie, need IC greater than 1 or Tobin’s Q above sector average for two further years)
Other ways of defining zombie firms might include ongoing debt capital raisings (e.g., Altman 2020)13, default probability estimates (e.g, Altman (1968)14 and Campbell, Hilscher and Szilagyi (2011)15) and receipt of subsidised (i.e., reduced rate) debt (e.g., CKH08).
No definition seems ideal. The profitability based measures seem to lend themselves to better comparison across universes and with preceding literature, so we use them. Our primary measure is:
- Three consecutive years of interest cover (IC) less than 1 (that is, T-2, T-1 and T)
- Tobin’s Q less than sector average
- Firm age greater than 3 years
This makes our measure closest to the “narrow” definition of Banerjee and Hofmann (2018). We examine sensitivity to this definition in a later section16. Keeping a firm age requirement seems reasonable as there is a good reason for young start-up firms to be excluded, but firms beyond a few years of age may still exhibit zombie-like characteristics. We also exclude all zero debt firms.
One question that arises is the distribution of interest cover across firms. Figure 5 below shows histograms for three years (1999, 2009, and 2019) for all stocks combined (the charts for each of the three universes looks quite similar). Note that the X axis is the lower bound of the histogram bars (e.g. “1” means between 1 and 2). The distributions are similar, with most firms concentrated between 1 and 2.
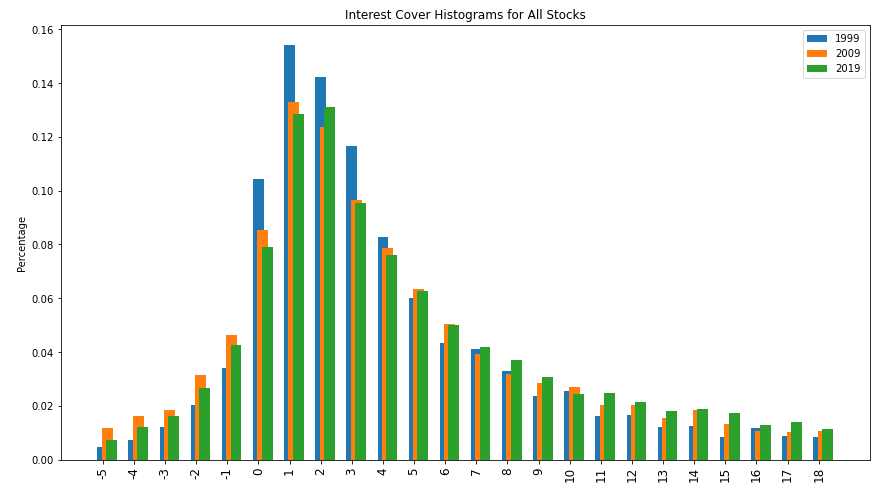
Figure 5: Histograms of Interest Cover Over Time: All Stocks
Source: Realindex, data as at 31 December 2019
In passing, we note that the distribution of interest cover for Japanese firms (Figure 6) looks quite different to other universes, with many more firms with high values, especially later in the sample. The reasons for this need further investigation, and may have an influence on our results, but is too much of digression for now.
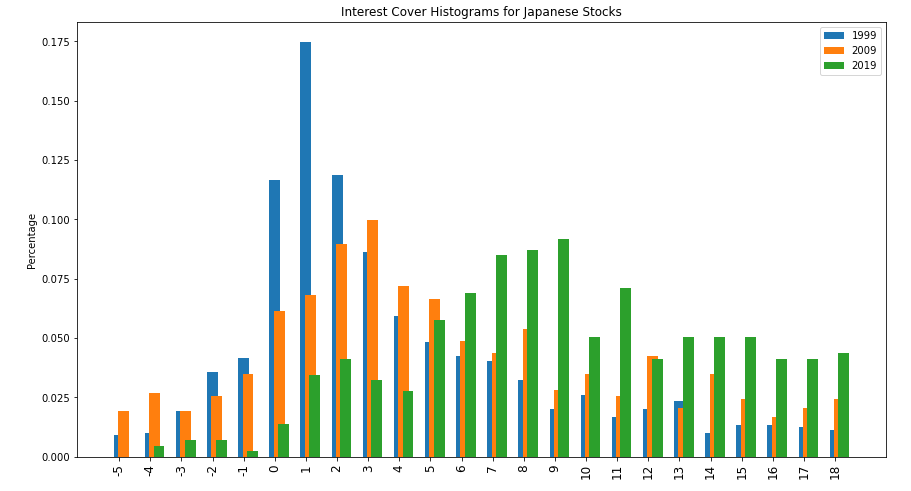
Figure 6: Histograms of Interest Cover Over Time: Japan Only
Source: Realindex, data as at 31 December 2019
Trend and Shape
Using our definition above, we construct the classification of zombie firms and calculate the proportion in each universe at each year. Figure 7 below shows the results:
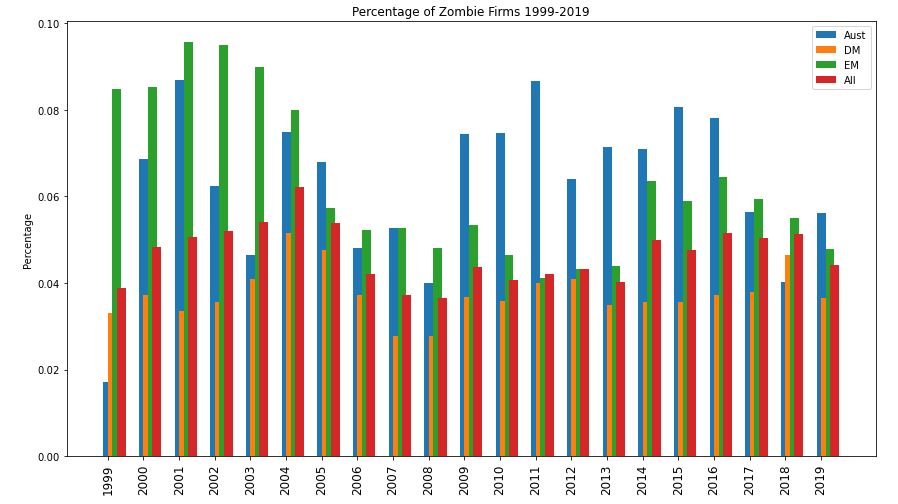
Figure 7: Percentage of Zombie Firms over Time
Source: Realindex, data as at 31 December 2019
These results are interesting and deserve a few comments:
- We do not see the increasing trend in zombie developed markets firms that Banerjee and Hofmann (2018, 2020) see. The proportion is fairly stable over the last decade at around 4% of the universe in each year.
- Emerging market zombies were a large proportion of the universe in the early 2000s
- Australian zombies were a large proportion of the universe post GFC
- On average, Australian firms are more likely to be zombies than the other universes. (Full sample percentages: Australia 6.4%, Developed Markets 3.6%, Emerging Markets 6.3%, all stocks 4.6%, US 3.7%, Japan 0.8%)
The lack of the previously observed developed market zombie trend is somewhat surprising. Changes in zombie firm definition do not change this result very much. A possible explanation of this is the different data sets we use: the Realindex data set is across all 24 Developed Market countries and is probably much more large-cap focussed than (for example) Banerjee and Hofmann. This size effect is examined below and this seems to yield a partial explanation for this difference.
Physical Characteristics of Zombies - size, sector, country
SIZE
As noted above a partial explanation of the lack of an increasing zombie trend in Developed Markets could be due to different samples, especially the small cap tail that the Banerjee and Hofmann data set must include. To look at this, we divide our Developed Markets universe up into deciles by market cap at each year (as indicated in the Legend), and then calculate the zombie percentage in each decile. Figure 8 below shows the results:
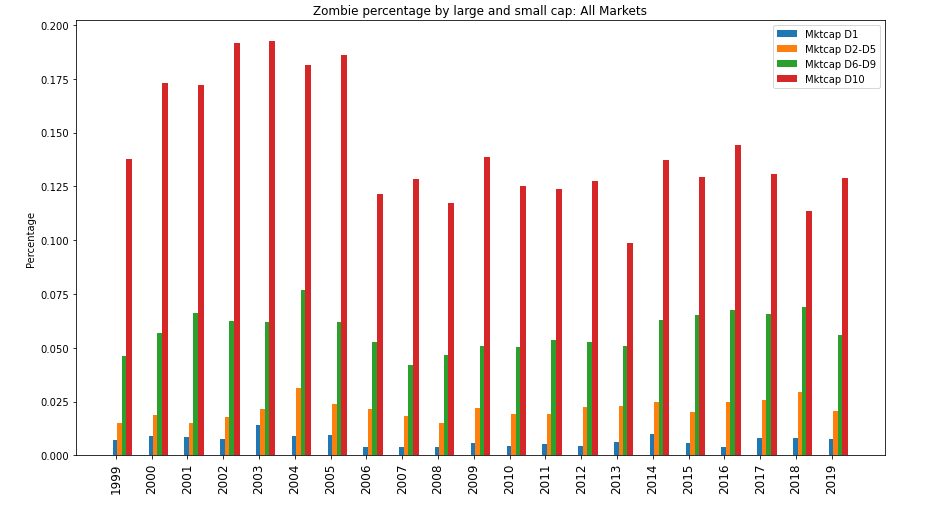
Figure 8a: Zombie Firm Percentages: Large and Small Cap: All Markets
Source: Realindex, data as at 31 December 2019
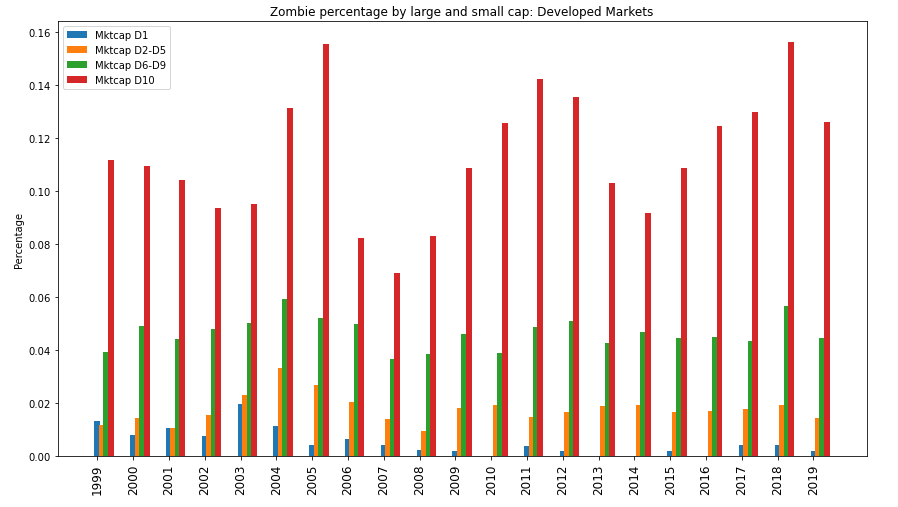
Figure 8b: Zombie Firm Percentages: Large and Small Cap: Developed Markets Only
Source: Realindex, data as at 31 December 2019
Previous research has shown that the zombie firm effect has a significant small cap bias, which we can also see here. In fact, the results are dominated by small caps. However, the recent increasing trend in zombie firms is only seen in the smallest decile of stocks, which suggests that this effect is small cap only. In fact, the proportion of large cap firms which classify as zombies is very small.
Looking just at the US, we see this small cap effect is quite pronounced, however we do not see it at all for Japan, which is the second largest Developed Market country by number of stocks.
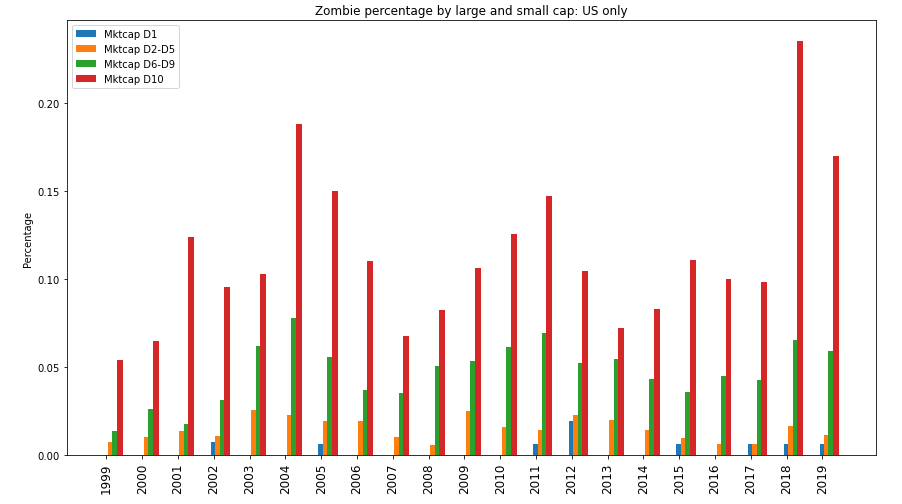
Figure 8c: Zombie Firm Percentages: Large and Small Cap: US Only
Source: Realindex, data as at 31 December 2019
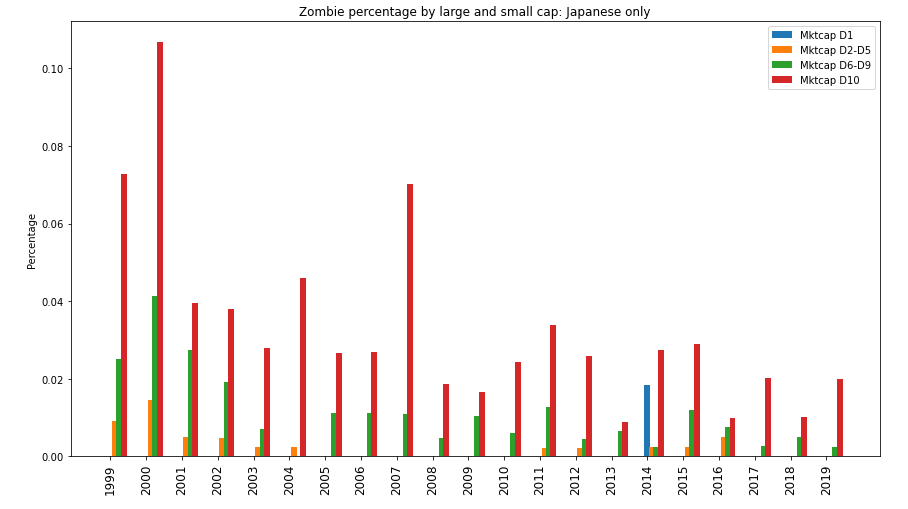
Figure 8d: Zombie Firm Percentages: Large and Small Cap: Japan Only
Source: Realindex, data as at 31 December 2019
SECTOR
Australia has a significantly larger proportion of zombie firms than the broader developed and emerging market data sets. Figure 9 below uses 2019 data, and shows why this occurs - it is largely a sector effect. The materials, energy and consumer staples sectors all have large zombie proportions. Note also that the Developed Market energy sector also has many zombie firms - the US energy sector, which has been known to be in difficulty, is the main driver. (Recall, we have excluded Financials from our data set.)
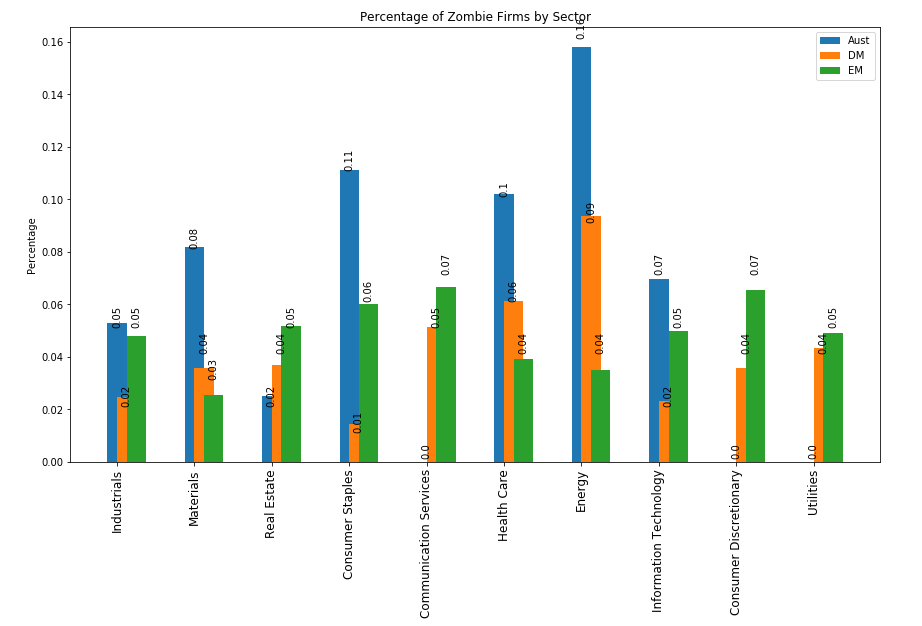
Figure 9: Zombie Firm Percentages by Sector (2019)
Source: Realindex, data as at 31 December 2019
COUNTRY
At a country level, there is also large variation in 2019. Figure 10 shows this for developed and emerging markets:
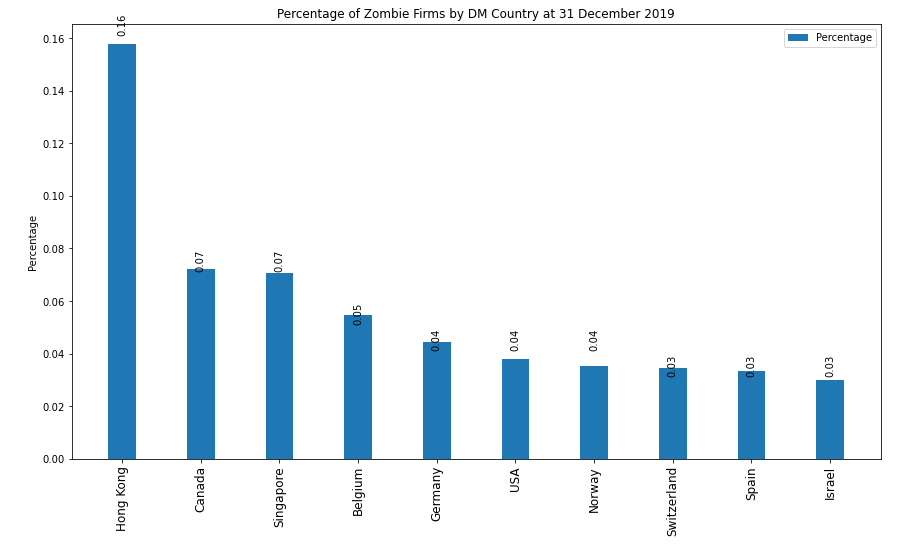
Figure 10a: Zombie Firm Percentages by DM Country (2019)
Source: Realindex, data as at 31 December 2019
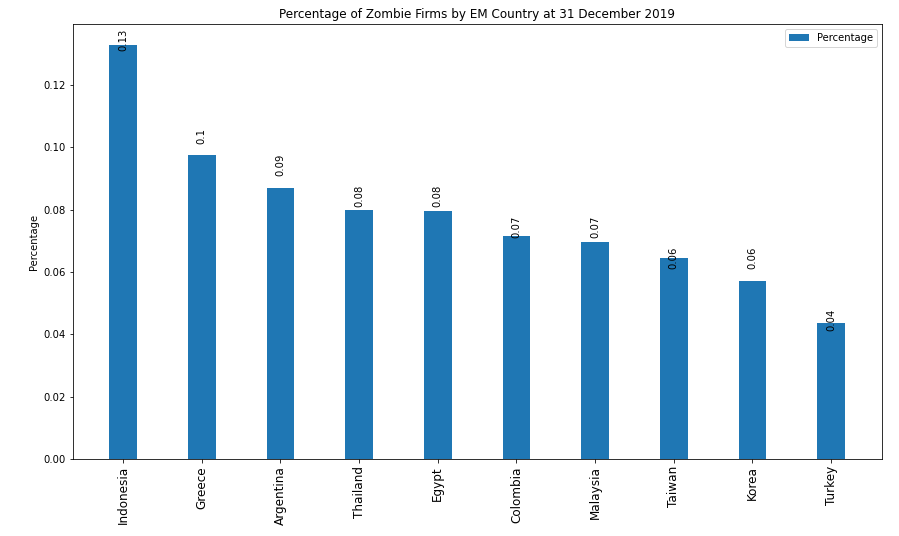
Figure 10b: Zombie Firm Percentages by EM Country (2019)
Source: Realindex, data as at 31 December 2019
Style Characteristics of Zombies - value, quality and momentum
We have already noted that zombie firms will look cheap when compared to the rest of the universe of stocks. Figure 11 below shows this using market-cap weighted-average book yield17 (charted here as Price to Book to give a more familiar measure). The blue bars represent the entire universe and the orange bars are the zombie firms alone.
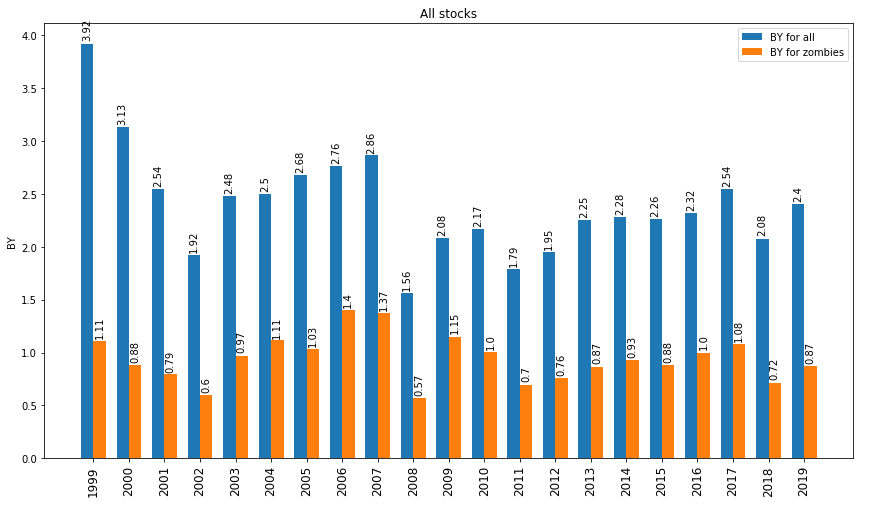
Figure 11: Book Yield: Zombies and Non Zombies: All Firms
Source: Realindex, data as at 31 December 2019
While valuation metrics show a significant difference, quality comparisons are even starker, especially when using ROE. We trim out stocks with ROEs less than -200% and more than +200%.
As we define zombie firms based on profitability, we expect the different groups to have wildly different ROEs, however the magnitude of the spread is very wide. Figure 12 shows this:
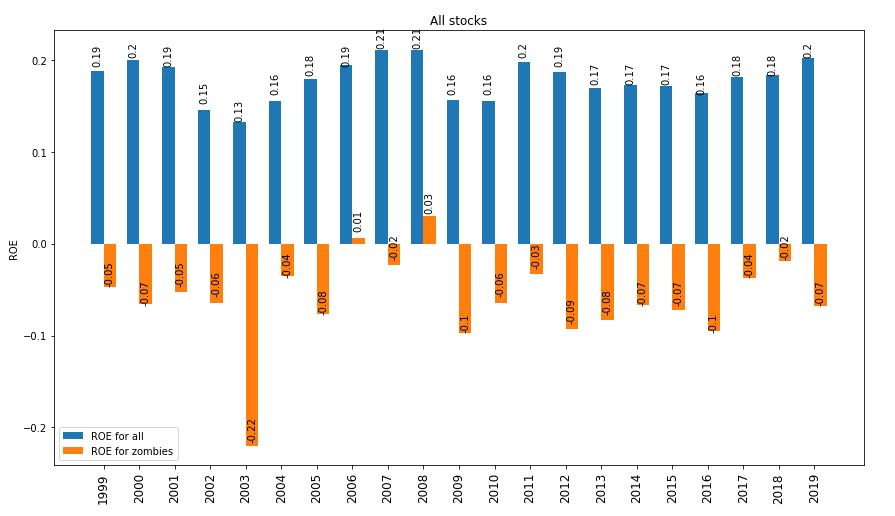
Figure 12: ROE: Zombies and Non Zombies: All Firms
Source: Realindex, data as at 31 December 2019
Finally, one common way to avoid stocks which are “cheap for a reason” is to tilt away from negative momentum18 names (and towards positive momentum). So do zombie firms show worse momentum than the broad universe of names?
The answer is yes, but it is not as strong as we might suspect. Using 12 month momentum (less the most recent month to avoid reversal), and the full universe of all stocks, we see that there is a difference in many years but it is not uniform in the same way as ROE or Price to Book. The period around the GFC shows the large sell off in 2008 followed by a large rebound in 2009, and the effect is magnified for zombie firms. Figure 13 shows this:
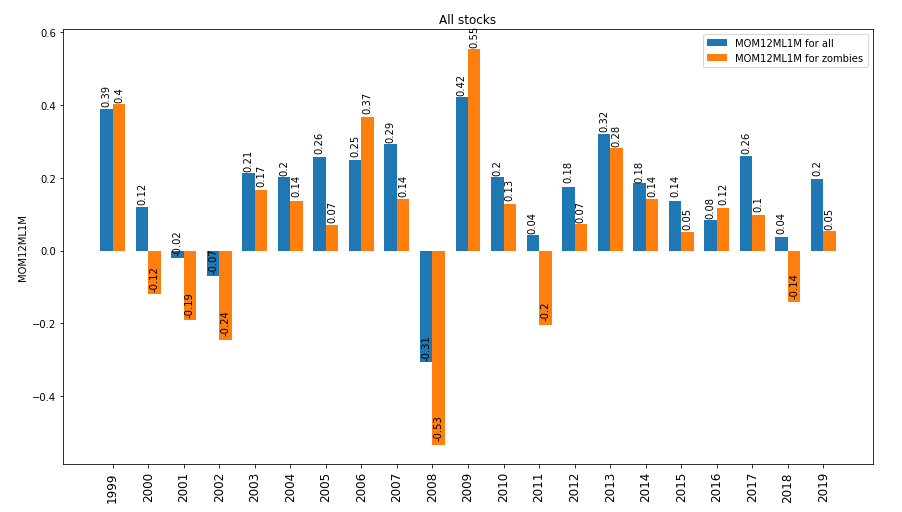
Figure 13: 12 month momentum (less most recent month): Zombies and Non Zombies: All Firms
Source: Realindex, data as at 31 December 2019
Finally, knowing that low ROE and poor momentum both have inflated zombie representation, we look at the four quadrants high and low ROE and momentum (using median values in each year). Again the universe is all stocks.
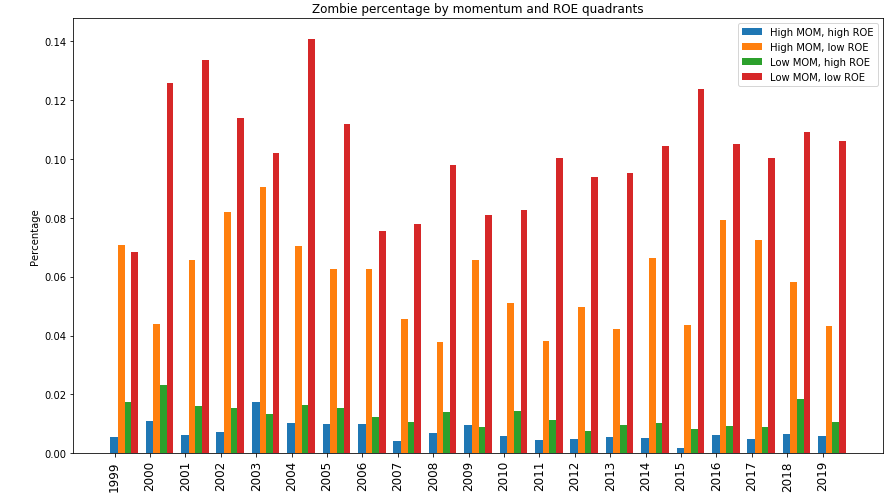
Figure 14: ROE and Momentum Quadrants: Zombie Percentages: All Firms
Source: Realindex, data as at 31 December 2019
Clearly, low ROE/low momentum names have the highest proportion of zombies. Next, even high momentum/low ROE names can have a very high proportion of zombies - that is, apparently good stocks on momentum (trending upwards) can have low ROE and be classified as zombies using our method. High ROE stocks are generally not zombies, no matter what the momentum.
Zombie Migration - back to life and as drivers of the value premium
When do zombie firms become zombies and when do they stop (if they do)? And how many are there? Research by Banerjee and Hofmann (2018, 2020), using their smaller market cap data set, find that being a zombie firm is quite persistent. To look at this, we examine two metrics:
- Percentage of stocks at any one year which are no longer zombies the following year
- Percentage of stock in any one year that are new zombies
Using our full data set, we see that these percentages are surprisingly high. The average percentage of stocks which come back to life is roughly 43% across all years, although it has trended down over time (suggesting that zombie firm membership is becoming more persistent). At the same time, the percentage of newly created zombies is slightly higher, at roughly 46% across all years. It also trends down slightly with time, indicating the zombies are more likely to remain so later in the sample. The chart below shows these percentages:
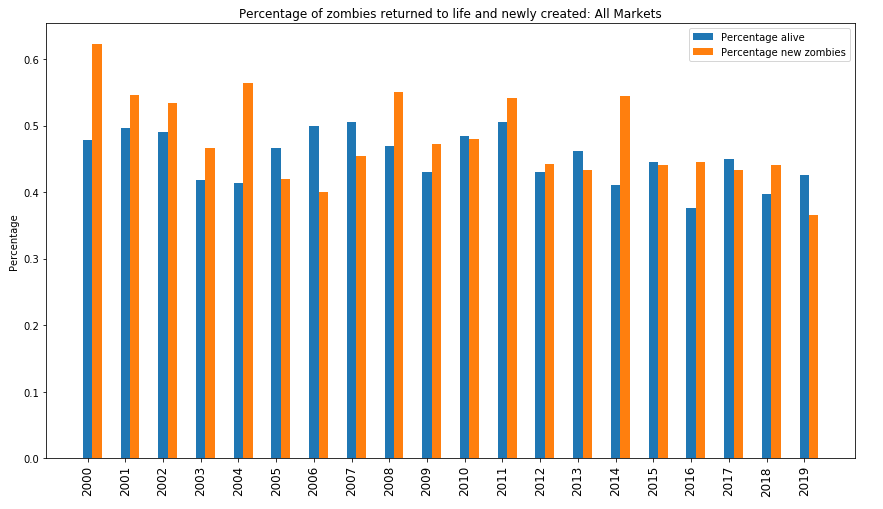
Figure 15: Percentages of Zombies Reanimated and Newly Created: All Firms
Source: Realindex, data as at 31 December 2019
We might reasonably expect that firms that stop being zombies will have better firm characteristics than the new entrants. Indeed we see this in the chart below. This shows the median Price-to-Book for both groups19. On average, new zombies have a price to book of 0.94, while reanimated zombies have an average price to book of 1.43. Recall from above that the full sample average price to book is 2.35, and for all zombies it is 0.94.
So if a zombie comes back to life, it has become more expensive but is still cheaper than the full sample. This might mean that reanimated zombies “migrate” upwards, supporting the chance of an excess return to value.
Over time, there is considerable variation in BY and ROE - see Figure 16 below. We see an even more significant result for ROE when compared to BY. In most cases (but not all), ROE for reanimated zombies (full sample average is 3.1%) is sharply better than for new zombies (full sample average is -5.5%):
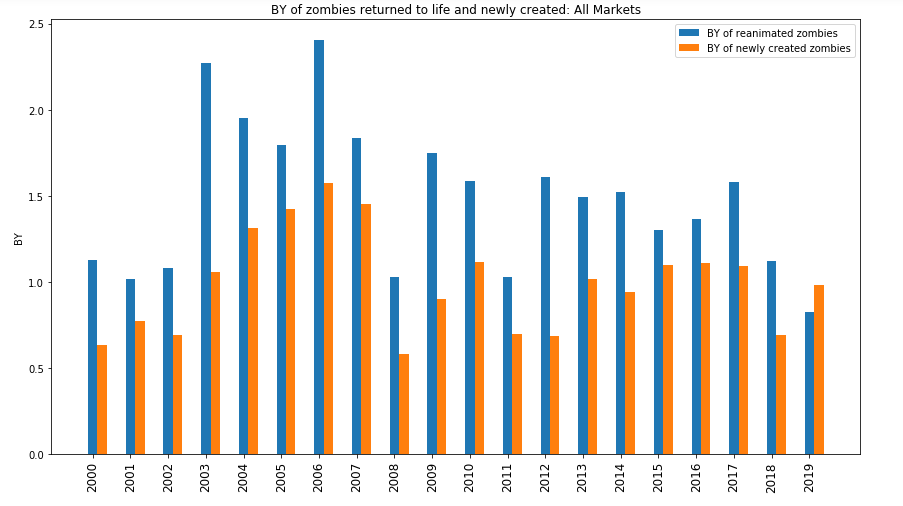
Figure 16a: BY of Zombies Reanimated and Newly Created: All Firms
Source: Realindex, data as at 31 December 2019
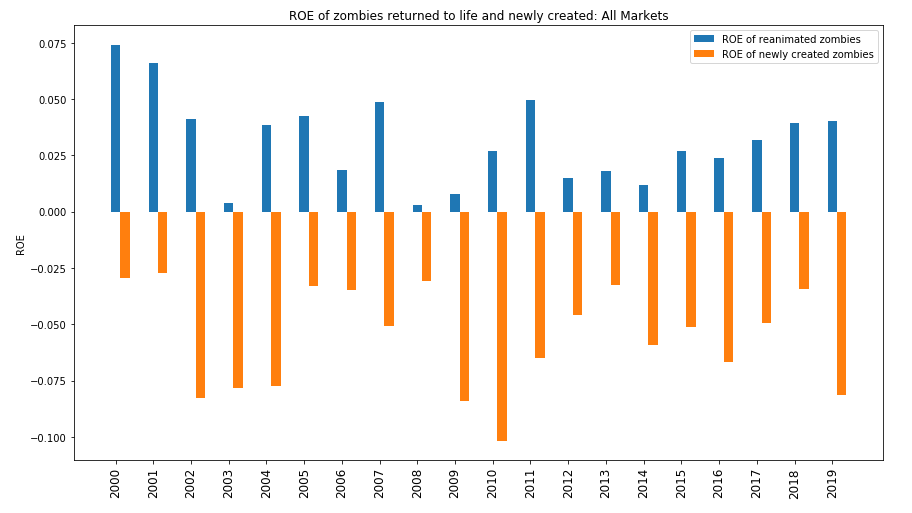
Figure 16b: ROE of Zombies Reanimated and Newly Created: All Firms
Source: Realindex, data as at 31 December 2019
Sensitivity to Definition
We observed earlier that these results are all quite sensitive to the definition of a corporate zombie. With our profitability-based measure, the choice of a threshold interest cover in particular seems to matter.
In the results above, we have chosen interest cover = 1 as our threshold. The charts below shows how much our results can vary if we use 0.5 and 1.5 instead. If we take just the stocks with interest cover between 0.0 and 4.0:
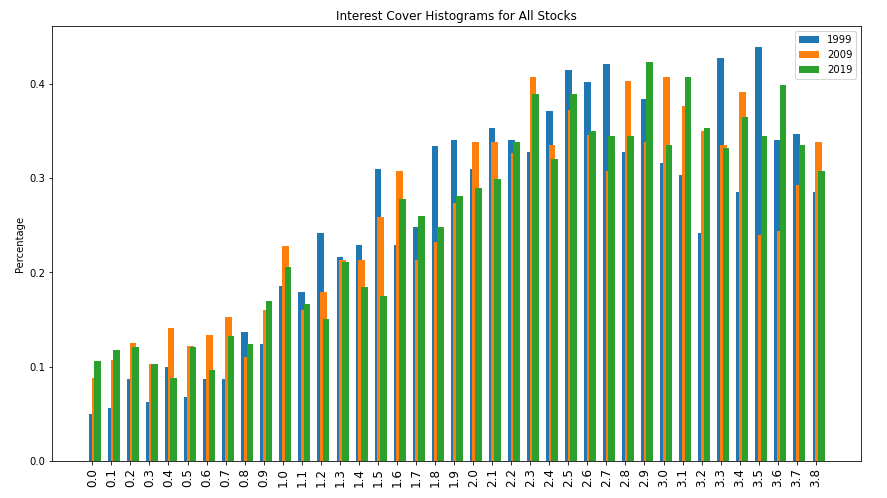
Figure 17: IC Histogram between 0.0 and 4.0: All Firms
Source: Realindex, data as at 31 December 2019
So it is hardly surprising that a slight change in interest cover threshold can create large changes in the results. The first chart below shows this for all stocks through time. Average zombies rates are 3.1% (IC threshold = 0.5), 4.6% (existing, IC threshold = 1.0) and 7.1% (IC threshold = 1.5). There is less sensitivity to changes in firm age, as the second chart shows. Here, average zombie rates are 4.6% (existing, years threshold = 3), 4.5% (years threshold = 5) and 3.4% (years threshold = 10):
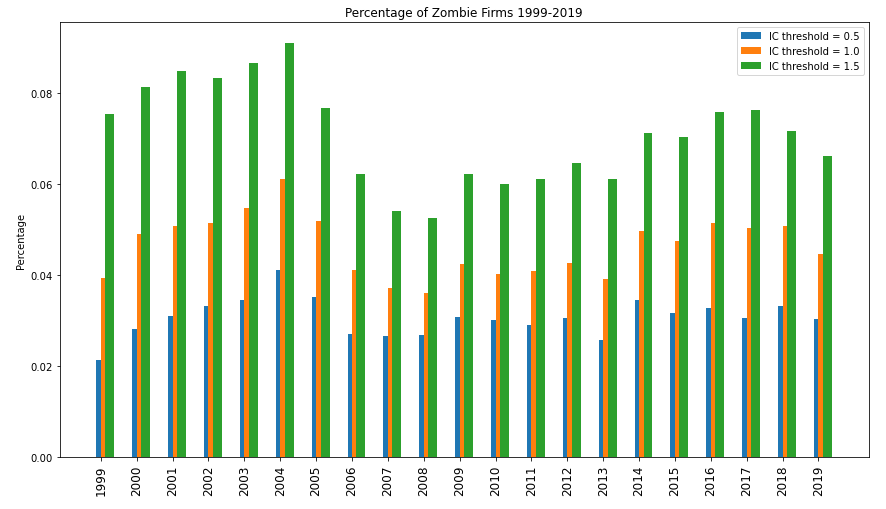
Figure 18a: Sensitivity to IC Threshold: All Firms
Source: Realindex, data as at 31 December 2019
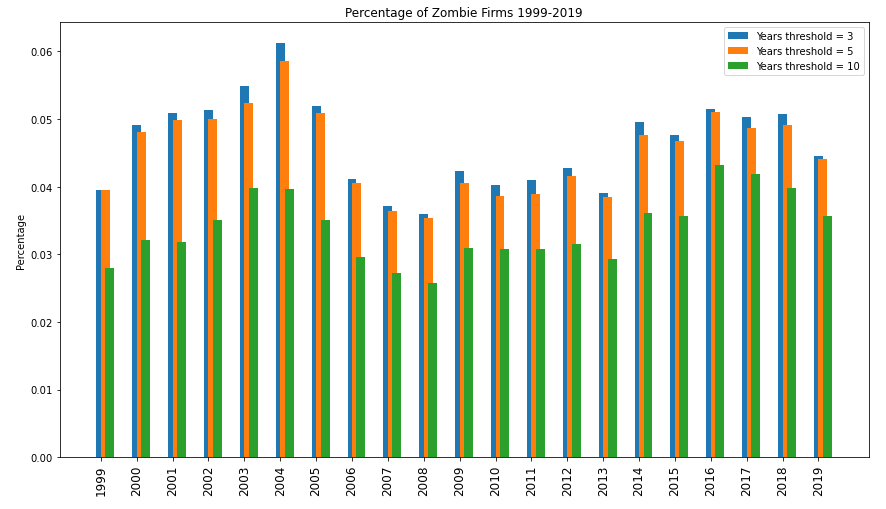
Figure 18b: Sensitivity to Years Threshold: All Firms
Source: Realindex, data as at 31 December 2019
Conclusions
We come to three main conclusions in this work:
- There is no question that the zombie firm problem exists. However, the recent upwards trend is primarily a small and micro-cap effect. Large stocks do appear as zombies but do not appear to be increasing in number.
- The definition used for zombie firms matters. We - like others - use a profitability based measure, but this may not apply well everywhere (for example, in Japan) and results can be quite sensitive to assumptions.
- Zombie firms (using our definition) are cheaper than the rest of the universe but also are much lower quality (measured as ROE). This is important to consider when building a value-based investment strategy. Stocks which re-appear (“reanimate”) show improving characteristics but are still cheap and of lower quality than the rest of the universe.
A future paper will look into how a quality overlay can act as a “zombie-repellent”, and how the Realindex investment process captures this idea.
For further information please contact:
| Andrew Francis Chief Executive +61 2 9010 5224 | Iain McLear Investment Manager +61 2 9010 5298 | Bonnie Chow Investment Analyst +61 2 9010 5240 |
Footnotes
1From https://anticap.wordpress.com/2010/10/30/return-of-zombie-ideas/
2This paper follows an earlier study entitled “COVID and Credit and Zombies” (Realinsights Deep Dive, 10-2020). Here, we use Realindex data to investigate some of the empirical nature of the zombie companies’ phenomenon in more detail.
3The Value style of investing refers to the strategy of investing in stocks that appear to be trading for less than their intrinsic value.
4Banerjee and Hofmann (2018), “The rise of zombie firms: causes and consequences”, Bank of International Settlements. Banerjee and Hofmann (2020), “Corporate zombies: Anatomy and Life Cycle”, Bank of International Settlements.
5Mean reversion theory suggests that asset prices and historical returns eventually revert to their long-run average level of the entire dataset.
6Altman, E (1968), Financial Ratios, Discriminant Analysis and the Prediction of Corporate Bankruptcy"
7Kane E. (1987): “Dangers of Capital Forbearance: The Case of the FSLIC and”Zombie" S&Ls", Contemporary Economic Policy
8Caballero, R, T Hoshi and A Kashyap (2008): “Zombie lending and depressed restructuring in Japan”, American Economic Review, vol 98, no 5, pp 1943-77.
9Adalet McGowan, M, D Andrews and V Millot (2017): “The walking dead: zombie firms and productivity performance in OECD countries”, OECD Economics Department Working Papers, no 1372.
10Banerjee and Hofmann (2018), “The rise of zombie firms: causes and consequences”, Bank of International Settlements.
11Op. cit., and Banerjee and Hofmann (2020), “Corporate zombies: Anatomy and Life Cycle”, Bank of International Settlements.
12Note that we also screen some extreme outliers from our data for Book Yield (BY) and ROE
13Altman, E (2020), “COVID-19 and the Credit Cycle”
14ibid
15Campbell, Hilscher and Szilagyi (2010), “Predicting Financial Distress”
16The definition low IC creates results that are surprisingly sensitive, as is discussed later. For example, if we define the lower bound as 0.9 or 1.1, rather than 1, the results can change markedly.
17If we use earnings yield we see a similar set of charts.
18Momentum refers to the rate of change in price movement of the stock.
19Outliers can create large variations in median so a small number of BY and ROE outliers were trimmed
Important Information
This material has been prepared and issued by First Sentier Investors Realindex Pty Ltd (ABN 24 133 312 017, AFSL 335381) (Realindex). Realindex forms part of First Sentier Investors, a global asset management business. First Sentier Investors is ultimately owned by Mitsubishi UFJ Financial Group, Inc (MUFG), a global financial group.
This material is directed at persons who are professional, sophisticated or ‘wholesale clients’ (as defined under the Corporations Act 2001 (Cth) (Corporations Act)) and has not been prepared for and is not intended for persons who are ‘retail clients’ (as defined under the Corporations Act). This material contains general information only. It is not intended to provide you with financial product advice and does not take into account your objectives, financial situation or needs. Before making an investment decision you should consider, with a financial advisor, whether this information is appropriate in light of your investment needs, objectives and financial situation. Any opinions expressed in this material are the opinions of the Realindex only and are subject to change without notice. Such opinions are not a recommendation to hold, purchase or sell a particular financial product and may not include all of the information needed to make an investment decision in relation to such a financial product.
The product disclosure statement (PDS) or Information Memorandum (IM) (as applicable) for those registered managed investment schemes mentioned herein that are managed by Realindex (Funds), which are issued by Colonial First State Investments Limited (ABN 98 002 348 352, AFSL 232468) (CFSIL), should be considered before deciding whether to acquire or hold units in the Funds. The PDS or IM are available from First Sentier Investors.
CFSIL is a subsidiary of the Commonwealth Bank of Australia (Bank). First Sentier Investors was acquired by MUFG on 2 August 2019 and is now financially and legally independent from the Bank. Realindex, MUFG, the Bank and their respective affiliates do not guarantee the performance of the Fund(s) or the repayment of capital by the Fund(s). Investments in the Fund(s) are not deposits or other liabilities of MUFG, the Bank nor their respective affiliates and investment-type products are subject to investment risk including loss of income and capital invested.
To the extent permitted by law, no liability is accepted by MUFG, Realindex, the Bank nor their affiliates for any loss or damage as a result of any reliance on this material. This material contains, or is based upon, information that Realindex believes to be accurate and reliable, however neither Realindex, MUFG, the Bank nor their respective affiliates offer any warranty that it contains no factual errors. No part of this material may be reproduced or transmitted in any form or by any means without the prior written consent of Realindex.
In Australia, ‘Colonial’, ‘CFS’ and ‘Colonial First State’ are trade marks of Colonial Holding Company Limited and ‘Colonial First State Investments’ is a trade mark of the Commonwealth Bank of Australia and all of these trade marks are used by First Sentier Investors under licence.
Total returns shown for the Fund(s) are gross returns and do not take into account any ongoing fees. No allowance has been made for taxation. Past performance is no indication of future performance.
Copyright © First Sentier Investors (Australia) Services Pty Limited 2020
All rights reserved.
 |  |
|---|