
Listed infrastructure has offered investors attractive risk-adjusted returns and lower correlations to traditional asset classes. This outcome has been achieved by providing effective downside protection during periods of equity market weakness.
In this article we analyse the performance of the Global Listed Infrastructure Fund1 in falling global equity markets. The underlying characteristics of listed infrastructure, combined with active management, enabled the Fund to preserve capital in falling markets on most occasions. For long-term investors, this consistent pattern of capturing most of the upside but less of the downside can accumulate into material outperformance.
Highlights
- Fund holdings in most infrastructure sectors delivered consistent outperformance during down markets.
- Water utilities proved most defensive, while gas and electricity utilities also outperformed.
- Toll roads and railroads were more sensitive to economic growth rates. Although these growth sectors proved less defensive than utilities, they held up better than global equities due to robust business models and strong market positions.
Looking ahead, most listed infrastructure companies are in good shape, with prudent levels of debt and conservative dividend payout ratios. Valuations are reasonable. These metrics suggest that the sector is well placed to continue to deliver effective downside protection during periods of equity market weakness to come.
The anatomy of downside protection
Listed infrastructure consists of real assets that provide essential services, often backed by contracted or regulated earnings. Steady demand and a relatively low sensitivity to the broader economic cycle enable infrastructure earnings to hold up at times when more cyclical businesses can struggle.
The overall beta of listed infrastructure compared to global equities has been around 0.7 over the long term. Broken down, this has translated to beta of over 0.8 in rising markets, and under 0.5 in falling markets, as illustrated in Chart 1. In essence; delivering most of the upside in rising markets, while offering protection from falling ones.
Chart 1: Global Infrastructure in MSCI World Up/Down Markets

FTSE Global Core Infrastructure 50/50 Net TR Index from Dec-05, previously Macquarie MSCI World Net TR Local. Monthly data for 15 years to May-19 Source: Bloomberg and First Sentier Investors.
Although the scale of these metrics appears relatively mild, this pattern of performance, combined with active management, has over time enabled the Fund to outperform global equities by a significant margin. It has outperformed global equities by 2.2% per annum2 since its inception in June 2007. Analysing the 15 discrete months when global equity markets fell the furthest, since the establishment of the strategy in 2007, provides a more detailed assessment of how this downside protection has been delivered to unit holders. The following data compares the performance of global equities during those 15 months with the returns of our flagship portfolio, the CFS Wholesale Global Listed Infrastructure Fund. This period encompasses a broad range of market conditions, including the 2008-9 Global Financial Crisis; Eurozone volatility in 2011; concerns about a slowing Chinese economy in 2015; and mounting trade tensions in 2017-8.
Fund performance in falling markets
Table 1 shows the performance of the CFS Wholesale Global Listed Infrastructure Fund during those months, ordered by the magnitude of MSCI World declines.
Table 1: Performance of the Fund vs MSCI World
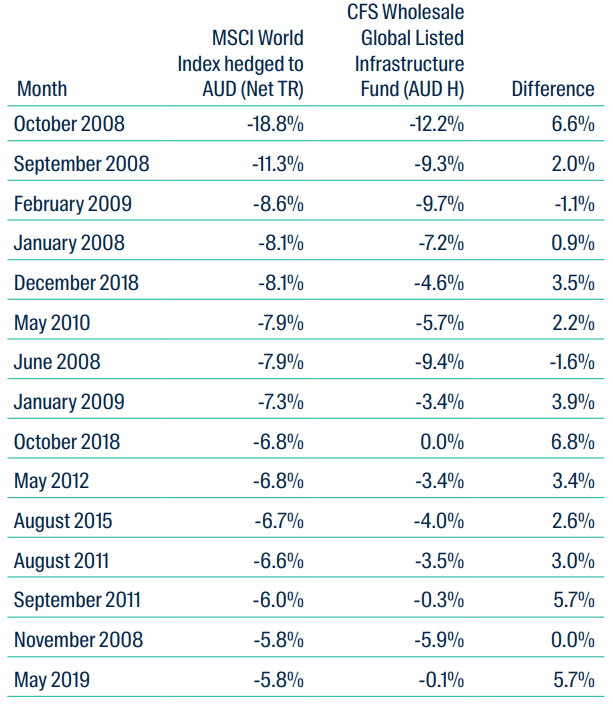
Fund performance is based on the CFS Wholesale Global Listed Infrastructure Fund, net of fees. Source: Bloomberg, First Sentier Investors.
The Fund outperformed global equites in 12 of these 15 down months, resulting in outperformance, on a simple average basis, of 2.9% per month. This represents beta of 0.6 compared to global equities. These details highlight three main points:
- Sometimes sell-offs can be indiscriminate. In 2008-09, markets were shocked by the collapse of credit markets and the risk of deep recessions around the world. The flight to safety and the need for liquidity saw equity markets tumble. Fund performance relative to the market in February 2009, for example, illustrates that few distinctions were being made between higher and lower quality stocks.
- As active stock pickers running conviction portfolios, we don’t always get it right. During other months (for example June 2008) fund positioning counted against us. Our holdings in those months included companies with high quality infrastructure assets such as Transurban and Macquarie Airports. However their debt levels and payout ratios were revealed to be unsustainably high, teaching us a valuable lesson.
- Most of the time, listed infrastructure’s underlying characteristics, combined with value-adding active management, enabled the Fund to preserve capital in falling markets. While this outcome is expected, it is encouraging to note the magnitude of outperformance during these periods of very worst market conditions, when investors seek a safe haven.
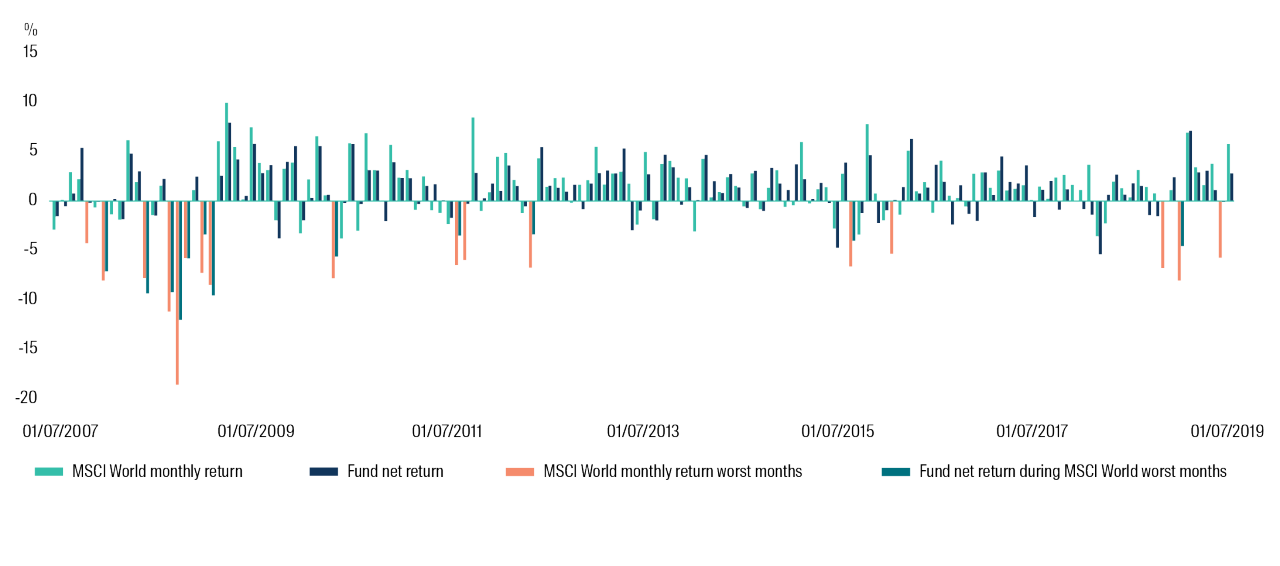
Chart 2 shows the dispersion of these down markets chronologically, illustrating the difficulty of predicting when they may arise, and emphasising the value of maintaining defensive exposures within a portfolio.
Chart 2: Chronological dispersion of down markets
Performance in falling markets by sector
We can look in more detail at the underlying sectors delivering this outperformance by comparing the average performance of the MSCI World during these 15 months (-8.2%) with the contribution of the Fund’s holdings in each infrastructure sector3, over the same time periods4. For example, the Fund’s water utility holdings – the most defensive infrastructure sector over the sample period as a whole – contributed -2.7% to returns on average during those 15 months; beating global equities’ equivalent average return during those months by +5.5%.
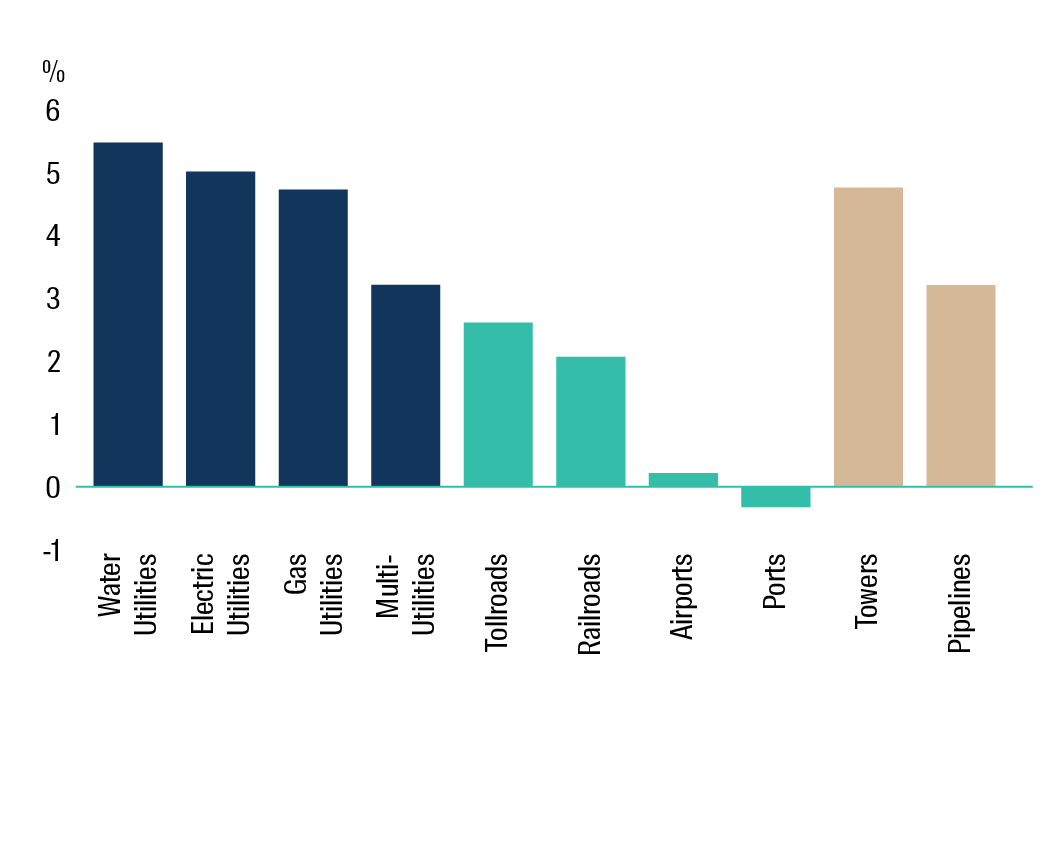
Chart 3 shows listed infrastructure sector performance, relative to global equities, during severe market downturns (ordered by most defensive sector to least defensive).
Chart 3: Average monthly outperformance during the 15 worst down months 2007 - 2019
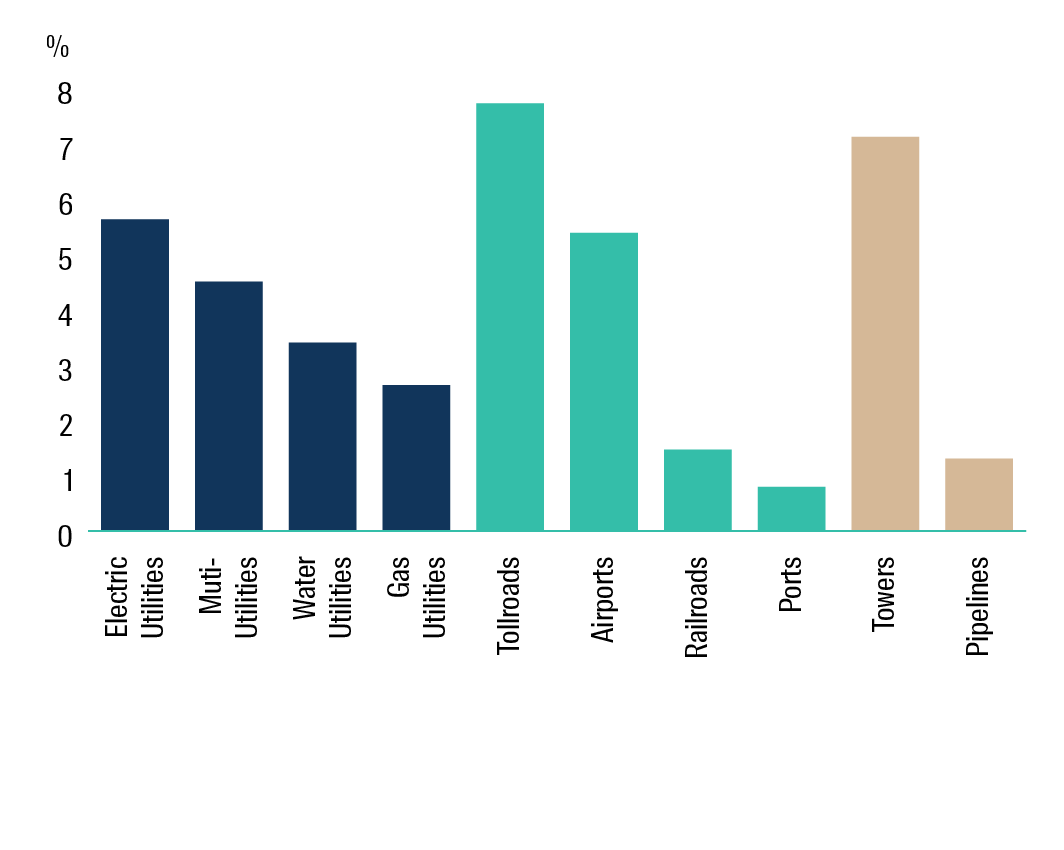
Freight rail sector excluded from months prior to 2010 due to sub-1% portfolio weighting.
Underlying drivers of performance
The most defensive sector of all during these down months was water utilities. American and British water companies, which dominate the listed water sector, operate within highly mature markets. They are typically allowed to earn a small premium to their underlying cost of capital, resulting in minimal volatility in each company’s returns throughout the regulatory period. Electricity and gas utilities also delivered significant outperformance. These stocks have very predictable patterns of steady demand underpinning their business models. Transmission and distribution networks tend to be monopoly suppliers of electricity and gas. Pricing is usually set by formal regulation of returns on equity, giving very clear visibility over future earnings streams. Mobile towers have tended to hold up relatively well due to structural growth which insulates them from the ebbs and flows of the broader global economy. The proliferation of smart phones has dramatically increased usage of mobile data, in turn driving demand for mobile towers. Planning restrictions on tower sites represent effective barriers to entry. Long-term contracts tend to provide for annual price escalators of around 3%, and help to minimise technology risk. The multi-utilities sector includes utilities with power generation segments as well as electricity transmission, gas production/storage and retailing activities. Power generation markets are less regulated and more competitive, which can result in a higher variation of return outcomes, relatively volatile earnings profiles, and potential vulnerability to weaker demand in power markets.
North American energy pipelines have faced headwinds in recent years. Volatile energy prices, combined with slower than expected regulatory approval for several substantial projects, have raised concerns about balance sheet stability. However the sector has provided effective defensive exposure during sharp market downturns. Pipeline tariffs tend to keep pace with inflation over time, while volumes are supported by long-term, take-or-pay contracts.
Toll roads and railroads are hard assets with high barriers to entry and demand profiles that are relatively insensitive to price increases. Although some dependence on economic growth rates meant these sectors proved less defensive than utilities, a number of inherent characteristics enabled them to hold up better than global equities. North American freight rail companies are unique and valuable franchises. Their wholly-owned track networks are high quality infrastructure assets which can never be replicated. Freight rail operators typically operate under duopoly market conditions, with significant numbers of captive customers such as grain, chemical and auto producers giving them strong pricing power over long haul routes. Improving operating efficiency provides further scope to grow earnings. Trucks compete over shorter distances, and volumes are linked relatively closely to economic growth. Japanese passenger rail companies are highly cash generative, stable businesses which operate some of the world’s busiest high speed rail lines.
Toll road revenues tend to be robust, with consistently high operating margins of between 60% and 80%, and the ability to match GDP growth over the long-term. Concessions are typically set over long time frames, with price increases often linked to inflation, and negotiated compensation for additional capital expenditure. Airports tend to operate under long-term leases and are subject to some form of regulation. Driven by globalisation, increased wealth and declining real airfares, passenger volumes have historically grown at multiples of GDP. Revenue from privately owned airports is typically well diversified with income from aeronautical, retailing and property services. Marine ports have historically delivered strong volume growth, reflecting the globalisation of trade. Volumes today are directly linked to global GDP growth rates; with port operators typically demonstrating high operating leverage. Significant trade routes include the import of bulk commodities to Asia and the subsequent export of containerised finished goods. Consolidation in the shipping industry has tilted the balance of power away from port operators to a certain extent.
Consistent outperformance through time
Splitting the data into three distinct periods (2008-2009, 2010-2012 and 2015-2019), results in the same pattern, as illustrated in Charts 4-6. This highlights the consistency of these defensive characteristics, regardless of the underlying triggers of equity market weakness.
Chart 4: Average monthly outperformance during 2008-2009 down months Global Financial Crisis5
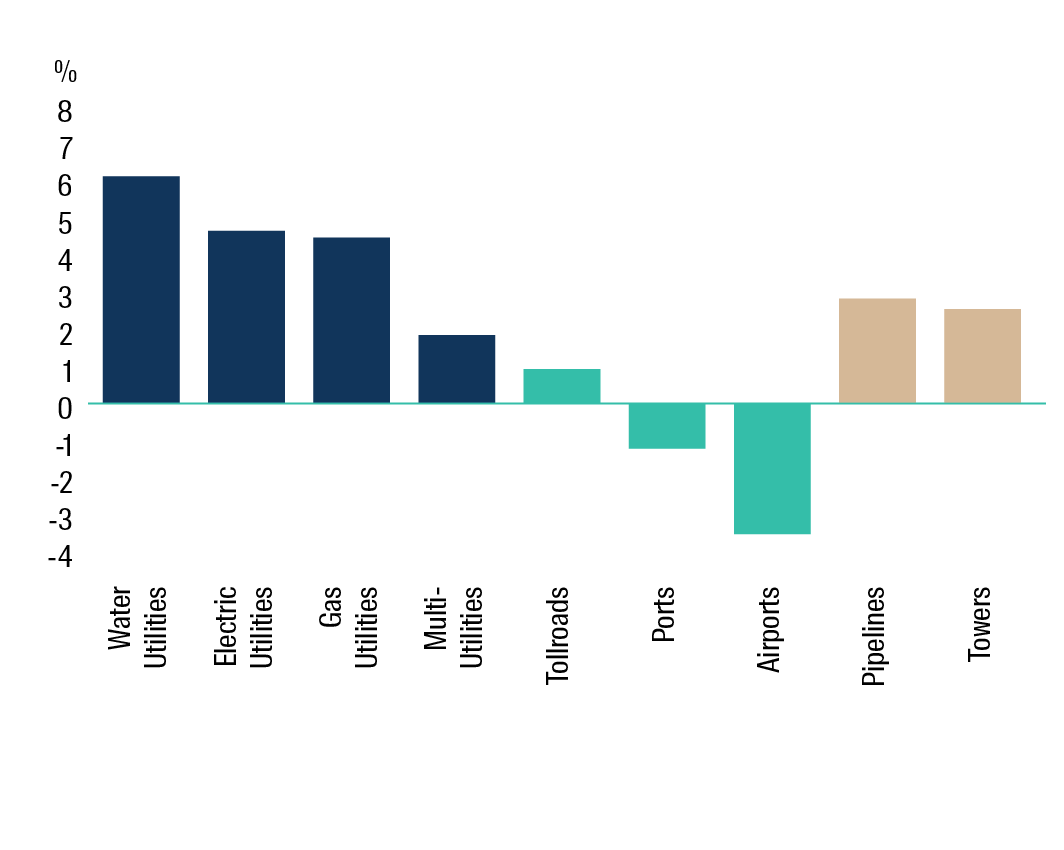
Chart 5: Average monthly outperformance during 2010-2012 down months Eurozone debt crisis
Source: Bloomberg, First Sentier Investors.
Chart 6: Average monthly outperformance during 2015-2019 down months China economic slowdown, trade war fears

Source: Bloomberg, First Sentier Investors.
Continued ability to provide downside protection Global listed infrastructure looks well positioned to continue to hold up in falling markets. The asset class consists of stable, long life assets, and continues to deliver a reliable yield of between 3% and 4% per annum. Listed infrastructure companies are in sound financial positions. Dividend payout ratios overall are prudent at around 70% and borrowing levels are reasonable, with average net debt/EBITDA ratios of between 3x and 5x. Debt refinancing at low interest rates has enabled infrastructure operators to reduce rates, lengthen maturities, spread refinancing risks, and diversify funding sources.
Several infrastructure sectors are benefitting from structural growth drivers such as urbanisation (Tollroads) and the increasing mobility of communication (Towers). Other listed infrastructure companies are taking proactive measures to streamline operational efficiency and improve business profitability. The implementation of Precision Scheduled Railroading by US freight railways Union Pacific and Norfolk Southern is improving customer service, reducing costs, and improving asset returns.
The cash yields of most infrastructure sectors are higher than dividend yields (see Chart 7) implying ample scope for payout ratios to be raised. This is especially the case for freight rail, toll roads and mobile towers. Although we are conscious that some infrastructure stocks (notably in the airports and utilities sectors) look expensive on fundamental measures, valuation levels overall are reasonable compared to long term averages, as shown in Chart 8. These robust metrics are likely to support listed infrastructure’s ability to deliver similar patterns of performance during periods of equity market weakness in the future.
Chart 7: Infrastructure yields by sector
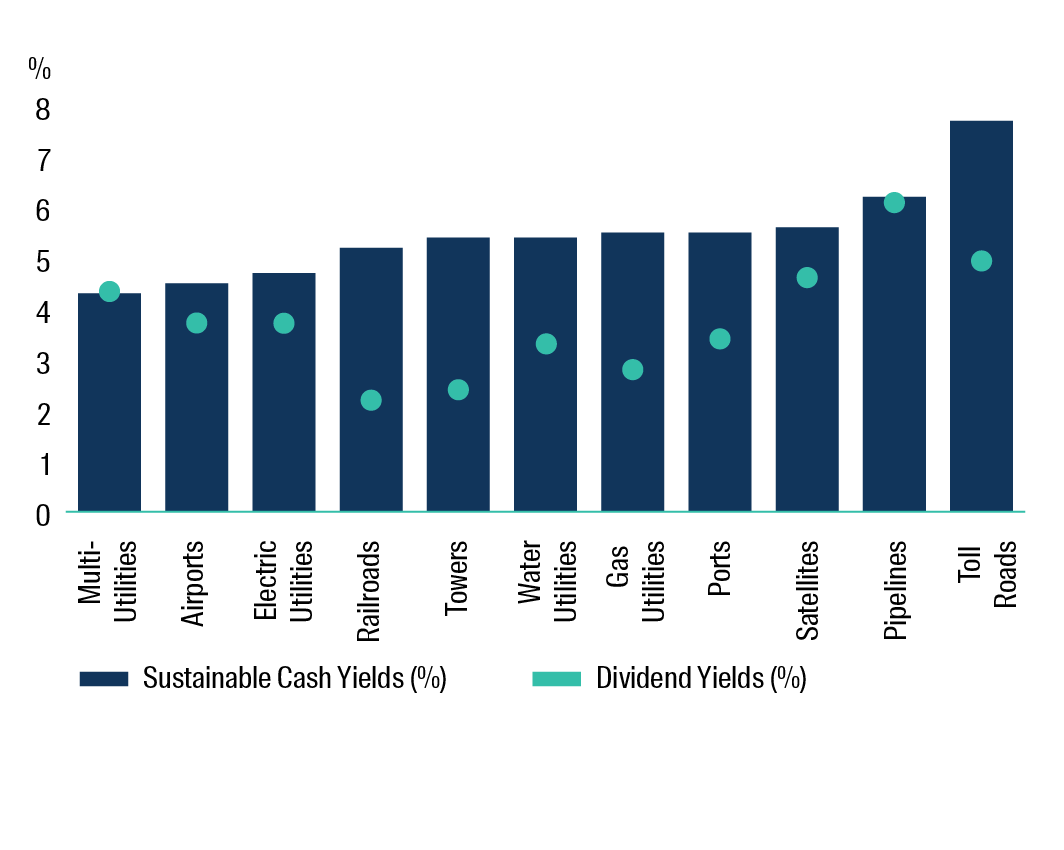
Source: First Sentier Investors.
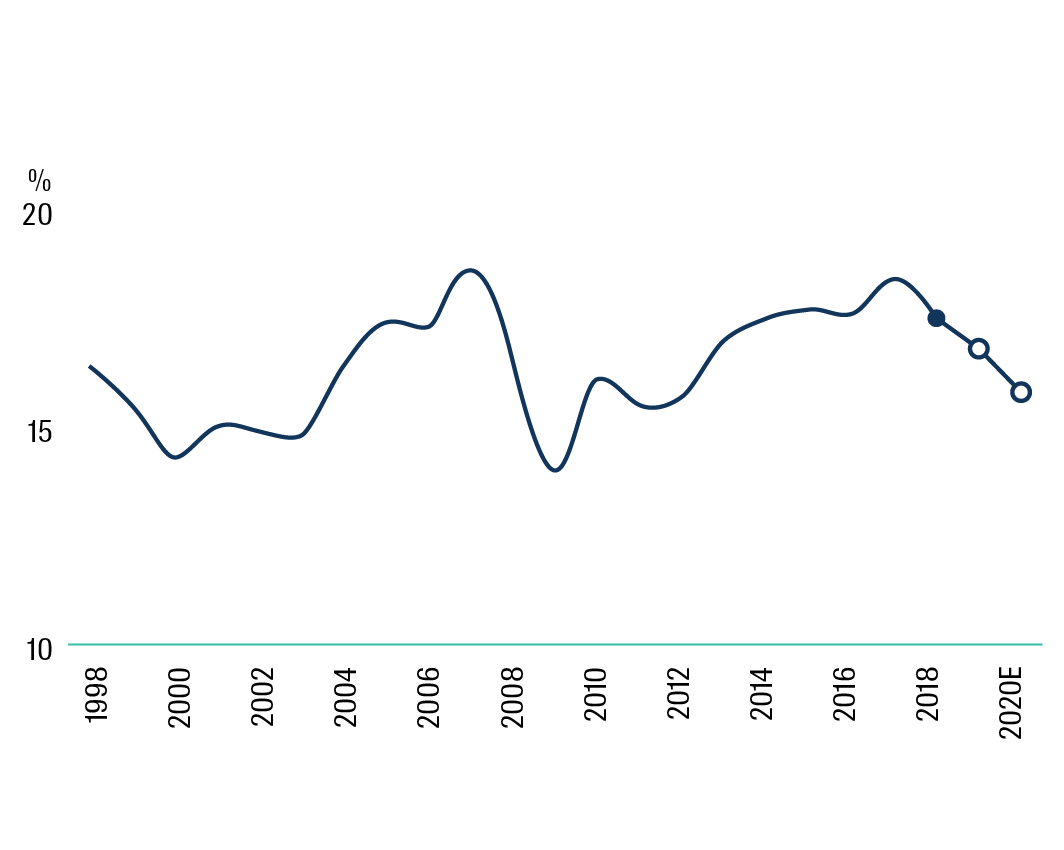
Chart 8: Global Infrastructure Price/Earnings x
Source: Bloomberg, First Sentier Investors. Simple average of 250 stocks in universe.
1 CFS Wholesale Global Listed Infrastructure Fund.
2 Net of fees, as at 31 May 2019
3 Satellites have been excluded due to the small sample size. The Fund’s position during these periods was always less than 4% of the portfolio, typically in just one stock. The satellite sector also proved defensive during these periods.
4 The contribution to return of each sector has been divided by the average portfolio weight of each sector to obtain a proxy comparison to global equities (and assumes a constant sector weight throughout the month).
5 Freight rail sector excluded due to sub-1% portfolio weighting
Important Information
This material has been prepared and issued by First Sentier Investors (Australia) IM Ltd (ABN 89 114 194 311, AFSL 289017) (Author). The Author forms part of First Sentier Investors, a global asset management business. First Sentier Investors is ultimately owned by Mitsubishi UFJ Financial Group, Inc (MUFG), a global financial group. A copy of the Financial Services Guide for the Author is available from First Sentier Investors on its website.
This material contains general information only. It is not intended to provide you with financial product advice and does not take into account your objectives, financial situation or needs. Before making an investment decision you should consider, with a financial advisor, whether this information is appropriate in light of your investment needs, objectives and financial situation. Any opinions expressed in this material are the opinions of the Author only and are subject to change without notice. Such opinions are not a recommendation to hold, purchase or sell a particular financial product and may not include all of the information needed to make an investment decision in relation to such a financial product.
To the extent permitted by law, no liability is accepted by MUFG, the Author nor their affiliates for any loss or damage as a result of any reliance on this material. This material contains, or is based upon, information that the Author believes to be accurate and reliable, however neither the Author, MUFG, nor their respective affiliates offer any warranty that it contains no factual errors. No part of this material may be reproduced or transmitted in any form or by any means without the prior written consent of the Author.
