
There are many high-quality small companies operating across all areas of the Australian economy. Some of these companies will one day grow into large, mature businesses. Identifying these stocks at the beginning of their journey provides investors with the potential for significant capital growth along the way. As small companies flourish, revenue and earnings growth are typically expanding at their fastest point in the company’s lifecycle – growth that larger, more mature companies would find difficult to replicate.
On the flip side there are, of course, many poor-quality companies in the S&P/ASX Small Ordinaries index. Just as some companies will become large, successful businesses, other companies will spend years floundering, or fall victim to unfavourable market conditions or poor management decisions. Investing in these companies can result in significant (or total) capital loss. The key, therefore, is picking the winners and avoiding the losers.
Dispersion and amplification of returns
One year share price performance – S&P/ASX 100 Index vs S&P/ASX Small Ordinaries Index
S&P/ASX Top 100 S&P/ASX Small Ordinaries Index
Company returns of index constituents one year to 30 June 2019
Source: Bloomberg, First Sentier Investors. 12 months ending 30 June 2019. Company total returns for 30 June 2018 to 30 June 2019 shown. Past performance is not indicative of future performance.
The chart above shows the one year returns of companies in the S&P/ ASX 100 Index and the S&P/ASX Small Ordinaries Index. The S&P/ASX 100 Index comprises of Australia’s largest 100 companies by market capitalisation. The S&P/ASX Small Ordinaries Index comprises of Australia’s 101-300 largest companies by market capitalization. It’s clear from the chart that the returns dispersion and amplification in the small caps universe is more magnified than in the large caps universe. Also of note is the number of small company stocks which performed extremely well, and the number that performed extremely poorly.
Out of 200 stocks in the S&P/ASX Small Ordinaries Index, 50 stocks – or one in four – lost 25% or more, including two that went into liquidation. In contrast, only 12 stocks in the S&P/ASX 100 lost 25% or more over the course of the year.
Dispersion of returns one year to 30 June 2019
Source Bloomberg, First Sentier Investors. At 30 June 2019. Small caps is S&P/ASX Small Ordinaries index. Large caps is S&P/ASX 100 index. Past performance is not indicative of future performance.
Amplification of returns one year to 30 June 2019
Source Bloomberg, First Sentier Investors. At 30 June 2019. Small caps is S&P/ASX Small Ordinaries index. Large caps is S&P/ASX 100 index. Past performance is not indicative of future performance.
The amplification and dispersion of returns underlines the critical importance of careful stock selection in small cap investing and the importance of focusing on downside risk. Successful small cap managers not only have to identify stocks with the potential for strong capital growth, but have to avoid the stocks which are likely to suffer sharp falls. Given the inherent risks in individual stock selection, why not diversify and mitigate this risk by simply owning the index?
The importance of being active
In addition to the wide divergence of returns, history shows that the larger cap S&P/ASX 100 index regularly outperforms the S&P/ASX Small Ordinaries index and with less volatility. Looking at the chart below, no investor would favour investing in small caps over their large cap counterparts.
S&P/ASX Small Ordinaries Index returns vs S&P/ASX 100 Index returns. Ten years to 30 June 2019
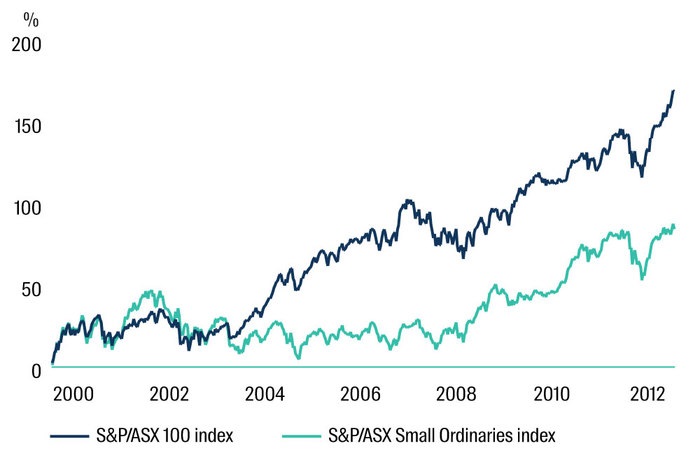
Source Bloomberg, First Sentier Investors. Cumulative total returns 30 June 2009 to 30 June 2019. Past performance is not indicative of future performance.
In the S&P/ASX Small Ordinaries index, the negative returns from numerous low-quality companies often erode the value created from more successful businesses. This means attempts to mitigate risk by diversifying across the index, for example via passive investments, is often not the optimal strategy for investors with regards to the risk/reward outcome.
However, the comparison of returns from the S&P/ASX 100 index and S&P/ASX Small Ordinaries index is too simplistic for one important reason; the index returns ignore the impact of excess returns, or ‘alpha generation’, that active managers can produce, which can be particularly significant in small caps.
Most stocks in the large cap S&P/ASX 100 Index are extensively researched by the professional investment community. They are mostly well known, mature companies with a large shareholder base. Investors like to hold large, mature companies because they are generally considered to be more predictable and less risky than their small cap counterparts. In contrast, small companies tend to be less well researched and understood. This provides the opportunity for skilled small cap managers to identify - through their own extensive research, resources and experience - companies that have the potential to be future leaders, and companies that have the propensity to fail.
By picking the winners and avoiding the losers, there is potential for significant alpha generation.
One company that looks to be on the way up
Breville ‘food thinkers’ is a branded small kitchen appliance manufacturer that has executed flawlessly in exporting their product intellectual property (IP)globally in a niche but highly scalable market.
While we have owned and followed this stock for some time, our position has built up in line with increasing confidence around the strategy put in place by Jim Clayton. He has been the steward of the business since July 2015, constructing a recipe for success through supply chain redesign. The company facilitates direct fulfilment and has invested in product research and development and increased marketing support.
This translation of global IP is best evidenced by the successful penetration of North America, UK and now Europe. The ‘pièce de résistance’? Significant scope for Breville to continue to extend its reach and penetration in both new and existing markets
Capital preservation is key
To help avoid the losers, small company fund managers should have a strong focus on downside risk and be invested in a concentrated group of quality stocks, which collectively have a better return profile than the index. In aggregate, a risk aware small cap fund is likely to have a larger allocation towards investments that have a clearly defined, articulated investment strategy, supported by a strong capital position and a proven and capable management team. The long term outcome of small cap companies that display such strategies can be strong return on capital and free cashflow generation.
So what effect does a strong focus on downside risk have on returns in the small cap space? The chart below shows the percentage of months the CFS Wholesale Small Companies Fund has performed in rising markets, falling markets, and all markets over a period of ten years.
Percentage of months outperforming (net) – CFS Wholesale Small Companies Fund 10 years to 30 June 2019
Source: First Sentier Investors. The chart shows the percentage of months the CFS Wholesale Small Companies Fund has outperformed its benchmark (S&P/ASX Small Ordinaries Index). Net returns shown after fees and taxes, between 30 June 2009 to 30 June 2019. Past performance is not an indication of future performance.
It is clear that when the market finishes the month in negative territory, the Fund is more likely to outperform (78.8% of the time over ten years). This is because higher-quality companies are typically more resilient during falling markets. It also demonstrates a propensity to avoid the biggest losers when times are bad.
During rising markets, the Fund outperforms less frequently. This is because the Fund doesn’t chase returns or invest in the ‘next big thing’. Rather, during all market conditions the Fund favours companies with sustainable competitive advantages, strong financials and predictable earnings. Performance over multiple investment market cycles has proven the effectiveness of this process to help pick the winners and avoid the losers.
This information has been prepared and issued by Colonial First State Asset Management (Australia) Limited (ABN 89 114 194 311, AFSL 289017) (CFSAMA) which forms part of First Sentier Investors, a global asset management business. First Sentier Investors is ultimately owned by Mitsubishi UFJ Financial Group, Inc (MUFG).
A copy of the Financial Services Guide for CFSAMA is available from First Sentier Investors on its website.
This material contains general information only. It is not intended to provide you with financial product advice and does not take into account your objectives, financial situation or needs. Before making an investment decision, you should consider, with a financial adviser, whether this information is appropriate in light of your investment needs, objectives and financial situation.
The product disclosure statement (PDS) and Information Memorandum (IM) for the Wholesale Australian Small Companies Fund, ARSN 089 460 891 (Fund), issued by Colonial First State Investments Limited (ABN 98 002 348 352, AFSL 232468) (CFSIL), should be considered before deciding whether to acquire or hold units in the Fund. The PDS or IM are available from First Sentier Investors.
CFSIL is a subsidiary of the Commonwealth Bank of Australia (Bank). First Sentier Investors was acquired by MUFG on 2 August 2019 and is now financially and legally independent from the Bank. The Bank, MUFG and their respective subsidiaries do not guarantee the performance of the Fund or the repayment of capital by the Fund. Investments in the Fund are not deposits or other liabilities of MUFG, the Bank or its subsidiaries, and investment-type products are subject to investment risk including loss of income and capital invested.
To the extent permitted by law, no liability is accepted by the Bank, MUFG or any affiliates thereof for any loss or damage as a result of any reliance on this information. This information is, or is based upon, information that we believe to be accurate and reliable, however neither the Bank, MUFG nor any affiliates thereof offer any warranty that it contains no factual errors.
No part of this material may be reproduced or transmitted in any form or by any means without the prior written consent of CFSAMA.
Total returns shown for the Fund(s) have been calculated using exit prices after taking into account all ongoing fees and assuming reinvestment of distributions. No allowance has been made for taxation. Past performance is no indication of future performance.
In Australia, ‘Colonial’, ‘CFS’ and ‘Colonial First State’ are trade marks of Colonial Holding Company and are used by First Sentier Investors under licence.
Copyright © Colonial First State Group Limited 2019
All rights reserved.
