Specialist in Asia Pacific, Japan, China, India and South East Asia and Global Emerging Market equities.
Discover moreformerly Realindex Investments
Leader in active quantitative equities across Australian equities, global equities, emerging markets and global small companies.
Backed by a unique blend of research, portfolio construction and risk management, focused on uncovering original insights and translating them into investment strategies that are active and systematic, aiming to generate alpha.
Discover moreInvestment strategies
Insights
At Stewart Investors, we believe in putting people first. Our investment world-view is of a series of partnerships – with each other, with our clients, with the companies we invest in, the people who buy their goods and services, and with the wider society in which we all live and work.
Discover more
In our last NAA review published in December 2019, we discussed the impacts on global markets caused by escalating geopolitical tensions. Since then, the US and China agreed upon a Phase One trade deal and the UK general election placed Boris Johnson in power, allowing the UK to officially leave the European Union and enter a transition period. Things were looking optimistic, until the COVID-19 virus outbreak emerged from China and began to migrate across the world in January 2020, causing widespread panic and enormous suffering in its wake. While this pandemic is not yet over, we explore the main areas of concern as we try to make sense of what the world might look like once we are on the other side.
What exactly is the NAA review?
The first step in our investment process is to determine the economic outlook, both globally and for individual countries. Twice a year, we formally review existing assumptions and determine the likely long-term values for inflation, risk free rates, long-term bond yields, and earnings growth. Using current valuations as a starting point, these determinations enable us to calculate expected returns for various asset types globally. In turn, this helps inform the most appropriate mix of investments (NAA) to deliver on our portfolio objectives.
COVID-19 – the virus that sent the world grinding to a halt
Reports of a coronavirus outbreak in Wuhan, China began to emerge in January 2020; but it was not until the Lunar New Year holiday period that it became evident just how far this could spread. Worldwide cases have now surpassed 3.5 million, and the virus has earned the ‘pandemic’ title from the World Health Organisation. The residents of Wuhan have finally seen lockdown measures eased after two months, however; COVID-19 and the harsh economic repercussions of containment continues to wreak havoc elsewhere, most notably in the US, Europe and the UK. As social distancing measures have led to the shut-down of non-essential businesses, many sectors are facing a severe pause in activity and the expectation for future company earnings is bleak. Restrictions have turned many capital cities into ghost towns with the expiry of lockdown measures in some regions not yet known. While many may try to speculate when we might be back to normal, it will remain to be seen just what ‘normal’ will mean again.
Global economies feel the pain
Cracks in the world’s largest economy are now wide open. The decline in the global trade outlook had regained optimism and the American consumer remained resilient until the COVID-19 effects made its way to the US and began its aggressive spread. According to the US Department of Labor, unemployment has spiked like never before, with over 30 million Americans filing for unemployment in the six weeks ending 25th April 2020. This has more than wiped out the 22 million jobs created in the employment boom since 2010. Unsurprisingly, the University of Michigan’s consumer sentiment index is sitting at 71.8 in April – the lowest level since December 2011. Manufacturing has also plunged in the US, with the Institute of Supply Management Manufacturing survey falling further into contractionary territory to 41.5 points (anything below 50 points is a contraction) – the lowest since the Global Financial Crisis (GFC) as orders both foreign and domestic have been either cancelled or postponed. As many services have come to a halt, the survey for US1 has fallen the most since the index began, to 29 points in April (with below 50 indicating a contraction). With both international and domestic travel heavily reduced or restricted, the stay at home orders are expected to drastically hurt the accommodation and food services sector. The US is not alone with a negative outlook. In the Eurozone, conditions were already fragile with Q4 2019 growth printing at only 0.1%. Unsurprisingly, the region contracted by 3.8% for Q1 20202 as some of the largest European economies – Spain, Italy and France – were some of the hardest hit nations of COVID-19. In Australia, consumer confidence plunged significantly by 17.7% during April; down to 75.63 , which is the lowest level since February 1991 (a level of 100 indicates more optimism than pessimism). In China, economic growth for Q1 2020 recorded a year-on-year contraction of 6.8% - the first GDP contraction since records began in 1992.4
Figure 1: US jobless claims surge to unprecedented levels
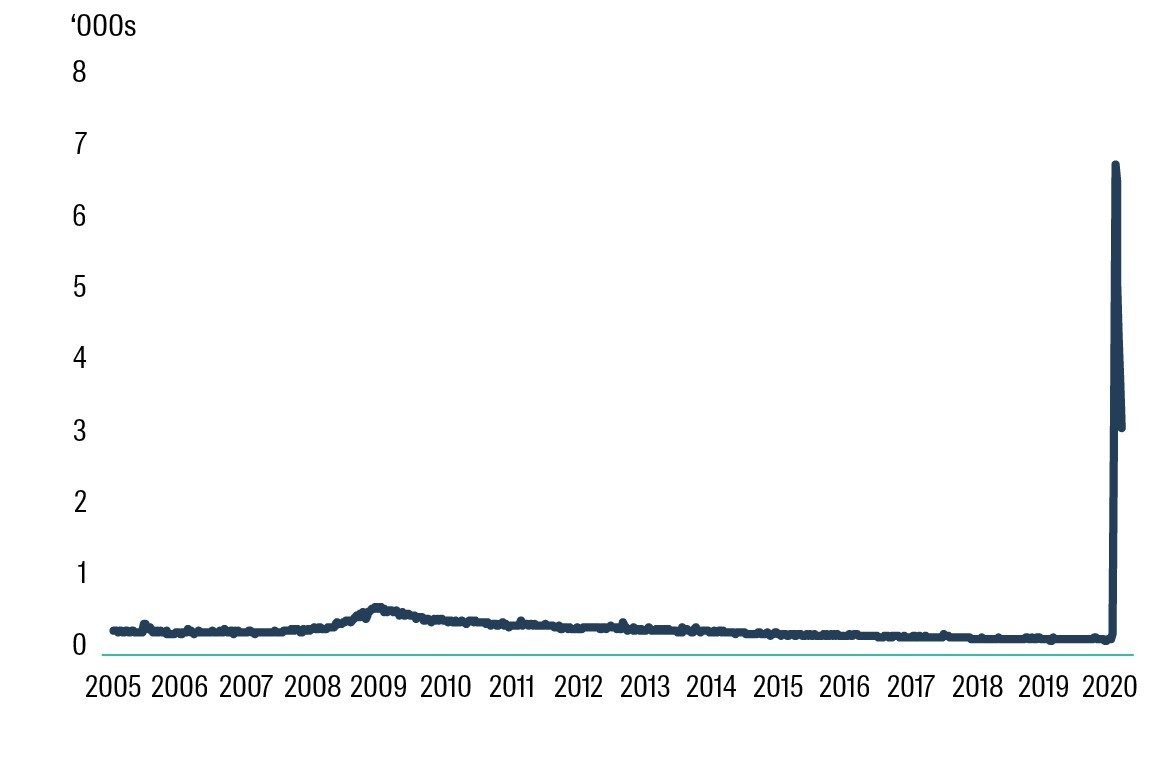
Source: FactSet 1 May 2020
Equity markets plunge after reaching all-time highs
During the last NAA review, we were still riding the longest US equity market bull run in history, reflecting on the fact that it had well and truly cheated death after more than bouncing back from the December 2018 stumble. The question on many minds however remained: how long would this go on for? What would bring it to its knees? On 19 February 2020, the S&P 500 closed at its new all-time high of 3,386.15 points. In the background however, COVID-19 was beginning to unnerve the global economy and in a somewhat belated response, US equities finally lost their balance, with the S&P 500 contracting by 8.6% for the month of February and by 19.6% for the first quarter of 2020 – a stark contrast from the 31% expansion over 2019! US equities of course were not alone, with the MSCI World and S&P/ASX 200 indices contracting by 20.0% and 23.1% in local currency terms respectively, for Q1 2020.
Figure 2: Raging bull meets ferocious bear
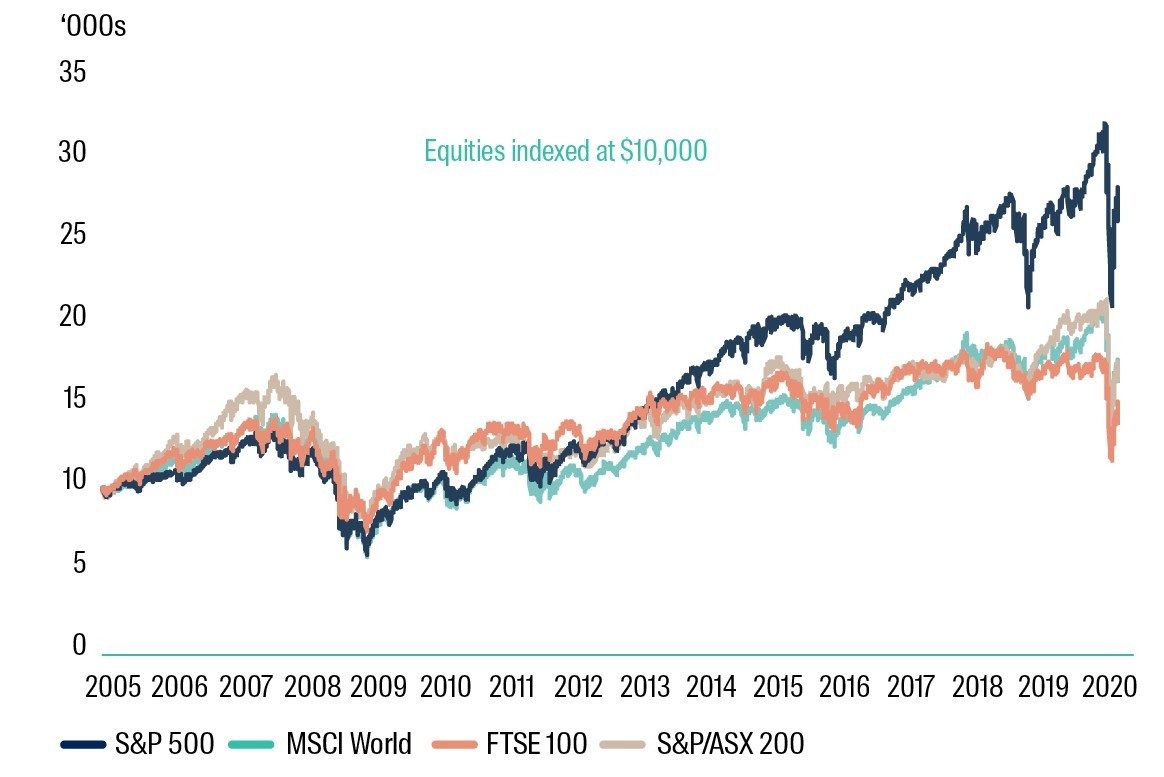
Source: Bloomberg, 31 March 2005 to 01 April 2020
While we cannot predict with perfect precision what lies in the future for equities, we can reflect on previous downturns for ideas. For example with the S&P 500 Index, the highest close of the mid-2000s bull market was 1,565 points in October 2007. It was not until April 2013 that the index managed to push above this milestone level. It is interesting to note that after previous US stock market crashes - excluding the Great Depression – the average recovery time was 27 months, with the 2008 crash taking 49 months (see Figure 3). As ever, past performance is no indication of the future….but it is all we have for now!
Figure 3: What goes down, must come up 5
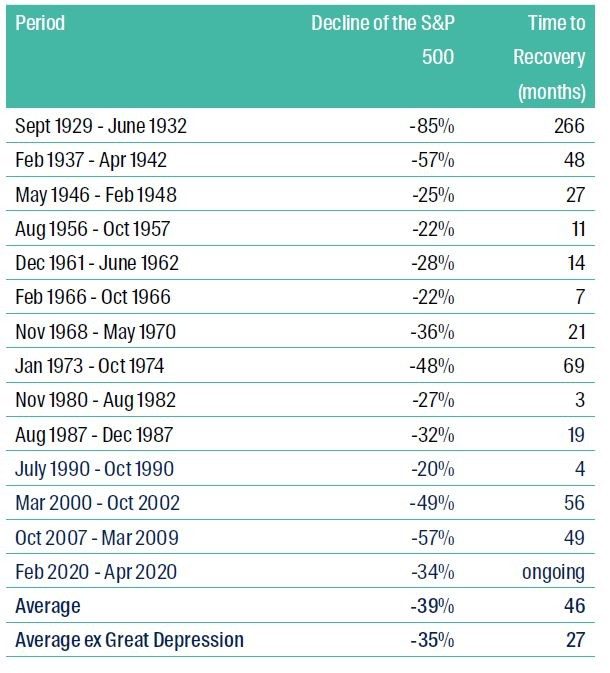
Source: Bloomberg and Goldman Sachs 30 April 2020
Here come the bailouts
As business activity levels stoop and unemployment gains frightening upward momentum, the world has seen a rapid increase in fiscal stimulus as governments try to stave off prolonged economic deterioration. The fiscal stimulus support will be of great help for businesses and the economy, but these initiatives may come with an expiration date….one that may not align with the length of this downturn! In the US, a fiscal stimulus package was unveiled of $US 2 trillion including a variety of measures. Support has similarly been unveiled across the world, with European Commission announcing a Corona Investment Fund, Eurozone finance ministers introducing a safety net for short-term work and unemployment benefits, in addition to packages from individual European governments6. This unprecedented government spending is expected to see a sharp spike in the issuance of global government debt, raising some concerns. Accruing such large debts in itself could have implications for future spending, if governments instead decide to direct their budgets to paying back these debts. Other considerations typically surround a sudden increase in fiscal spending, including the possible increase of inflation. Under normal circumstances, the vast spending packages could be expected to add inflationary pressure. Given the potential offsetting impacts of rising unemployment and shocks to both supply and demand, however, it is unlikely that inflation will materialise broadly within the wider economy, in our view.
Data collected from the Australian Bureau of Statistics already indicates that as at 1 May 2020, 78% of businesses in the accommodation and food sector are negatively affected by the outbreak, with tourism also suffering as international travel is restricted. Chinese tourists alone accounted for 15% of visitor arrivals and spent $10 billion in the 2018-19 year.7 Unemployment in Australia was 5.2% in March; however this survey was taken too early to account for COVID-19 effects. The Reserve Bank of Australia has indicated that unemployment could reach as high as 10% by mid-year. The Australian Federal Government has already unveiled a $ 17.6 billion package followed by another $ 66.1 billion fiscal stimulus package. This is in addition to the $ 130 billion ‘Job Keeper’ package aimed at preventing mass layoffs and keeping workers employed for when lockdown measures are eased. Fortunately, the number of new and active virus cases in Australia continues to dwindle, but the road to recovery is likely to be long.
Figure 4: Fiscal Stimulus as a percentage of GDP as at early April
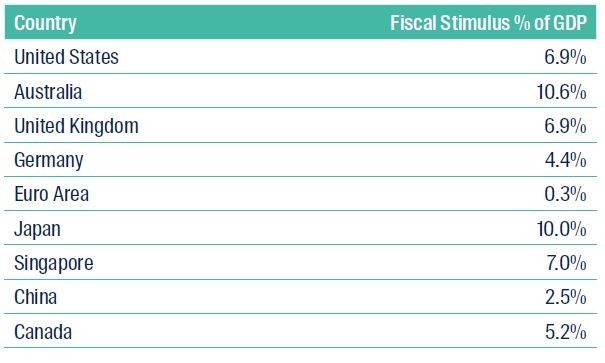
Source: International Monetary Fund (IMF) as at 8 April 2020.
Central banks to the rescue (again)
In a synchronised fashion, central banks around the world responded to the COVID-19 outbreak with extraordinary measures in the form of capital injections and interest rate cuts. Many countries were sitting on relatively low (or negative in some instances) interest rates but in the time of need, more cuts were unveiled. Monetary policy rate changes were made to boost the cash of businesses and the household sector. While this is problematic for anyone relying on interest income, it does lower borrowing costs for businesses as well as the Government at a time when fiscal spending is rampant. Both the US Federal Reserve and Reserve Bank of Australia had been steadily reducing rates in the second half of 2019 before lowering rates twice in the month of March to 0-0.25% and 0.25% respectively. The Bank of England slashed borrowing costs to 0.10% after it had remained at 0.75% since August 2018. In addition to lowering interest rates, other various initiatives have been implemented such as repurchase operations, quantitative easing programs, asset purchase programs, and funding facilities to name a few. The European Central Bank has also utilised some of its flexibility by focussing its government bond purchases in countries most impacted by the virus such as Italy and Spain. The traditional relationship between risk and defensive assets broke down as the second half of March saw an unparalleled sell off for equities, bonds and commodities. While defensive assets such as government bonds would traditionally expect to benefit from such market uncertainty, the COVID-19 outbreak proved that even bonds could not sufficiently provide comfort as investors instead rushed towards cold hard cash. Consequently, liquidity in the financial system dried up, pushing central banks to intervene and inject capital. The corporate bond market saw spreads widen to levels last seen in the GFC – both in the investment grade and high yield market. Some support was found however when the US Federal Reserve announced the inclusion of corporate securities as part of its enormous asset purchase program, pushing spreads tighter.
Figure 5: Global Policy Rates
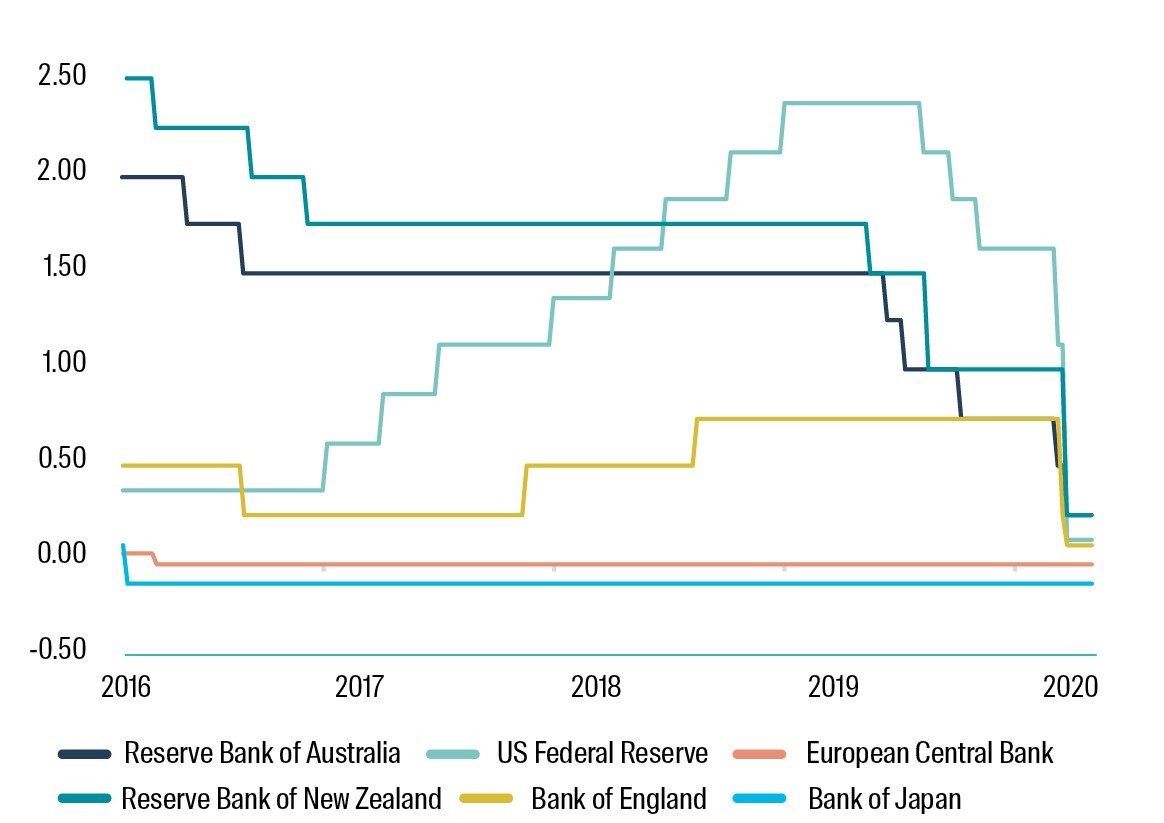
Source: Bloomberg 30 April 2020
Figure 6: Credit spreads 12 months to date
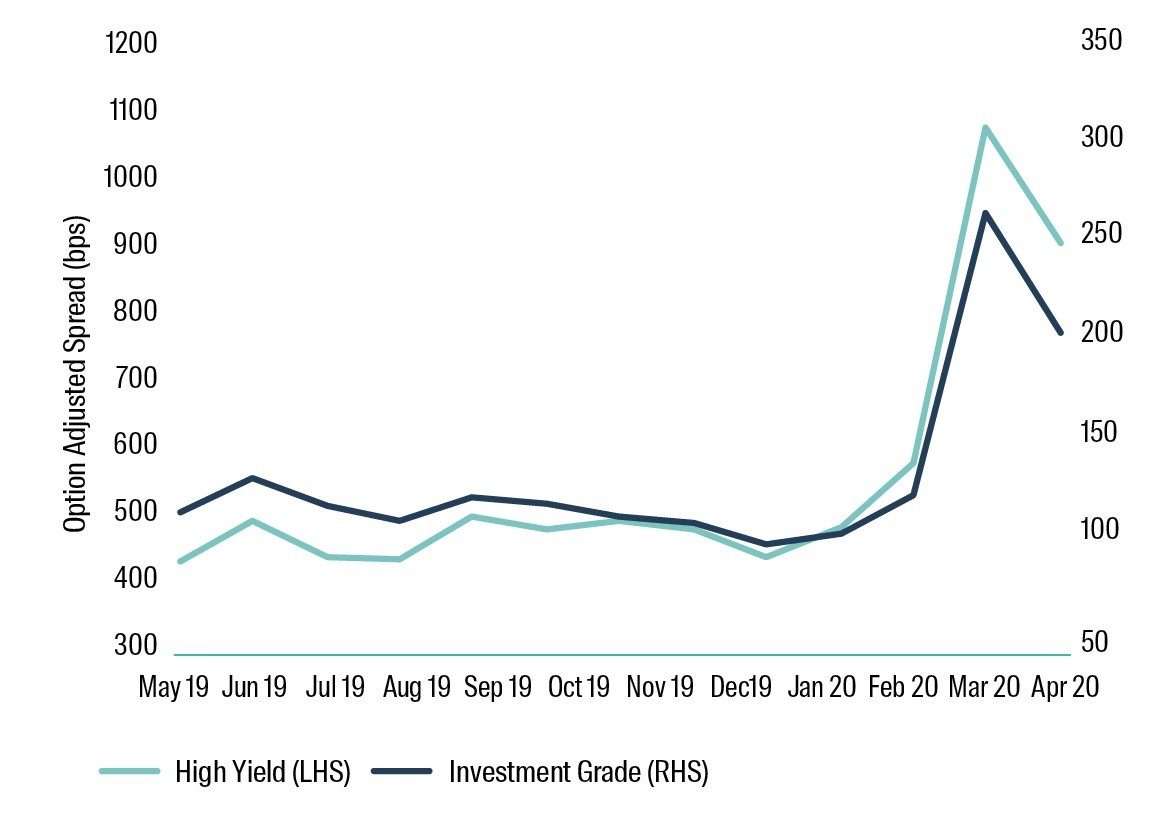
Source: Barclays 30 April 2020
Currency volatility as investors retreat to safe havens
Just as both risk and defensive assets experienced tumultuous moves, foreign exchange markets joined them for the ride asinvestors grasped for safe haven assets. The US dollar, a safe haven currency, was volatile across March, remaining steady against the Euro and Japanese Yen, but rising against most other currencies as COVID-19 related uncertainty surged. The US dollar moved within a sizeable 100 basis point range over March but found support during April as panic slightly reduced. Since this crisis has unfolded, emerging market currencies have fallen to record lows. In mid-March, the British Pound fell towards a 35-year low against the US dollar as market risk aversion spiked.
The Australian dollar also underperformed during a volatile March, reaching the lowest level since 2002 of 0.551 against the US on the same day the RBA announced quantitative easing and lowered interest rates.
Commodities: Oil suffers unthinkable supply AND demand shock
At first, oil prices faced pressure as Russia, Saudi Arabia and the OPEC+ members refused to agree on production cuts. Instead, the market was flooded with oversupply, driving prices downward. While OPEC+ and G20 production cuts commenced on 1 May 2020, it looks like nobody wants oil anyway. Demand itself has nosedived as COVID-19 led to a grounding of flights across the world, in addition to the severe slowdown in economic activity. Then the West Texas Intermediate (WTI) crude oil futures contract for May 2020 – a benchmark for oil prices in the US – dipped into negative territory and closed the day at –US$37 as holders scrambled to sell their contracts before they were in the predicament of having barrels of oil and nowhere to store them. While the outlook for WTI futures may improve slightly, a resounding recovery will require patience. Turmoil in the oil market also encouraged the selloff of high yield bonds, which have a large sector allocation to energy.
Figure 7: West Texas Intermediate (WTI) Crude Oil futures
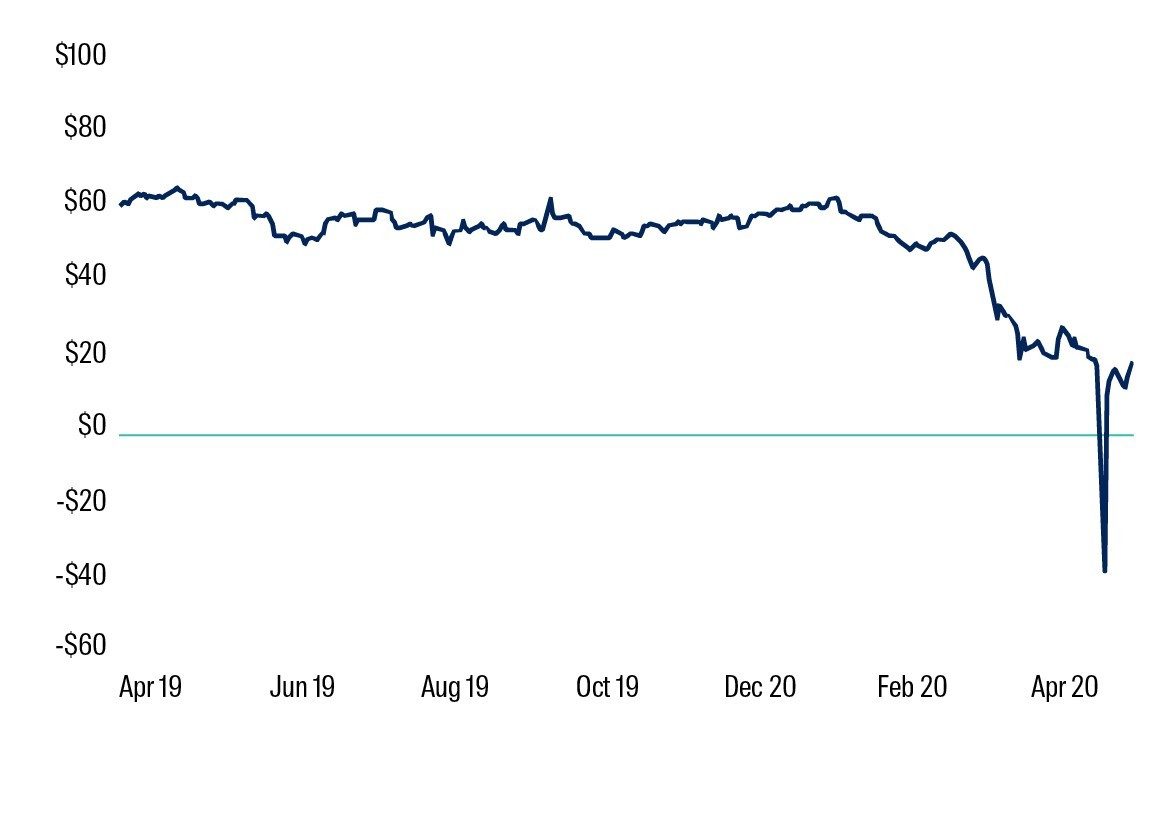
Source: Bloomberg 30 April 2020
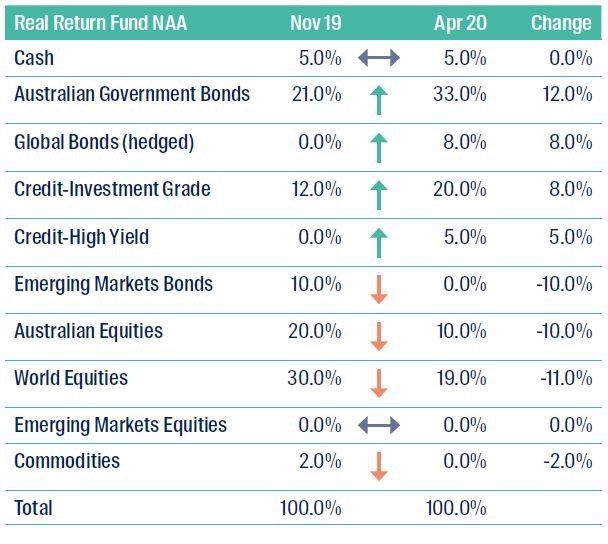
CFS Multi-Asset Real Return Fund: Neutral Asset Allocation as at April 2020
Equities
In light of the recent volatility in financial markets, the portfolio’s allocation to equities has severely reduced since our last review. The collective weight to Australian and global equities has gone from 50% to 29%. We are increasingly cautious of the continued knock-on effects from the COVID-19 outbreak and while equity markets may be trying to look through into a more optimistic future, we think this may be premature. Instead, we anticipate the severe reduction in business activity flowing through to earnings falling drastically. Since our last review, developed world equities reached new heights before falling off a cliff’s edge, with the MSCI World Index contracting by -9.5% over the period 30 November 2019 to 30 April 2020 in local currency terms. Optimism was on the rise as the year began with trade negotiations making good headway and the UK successfully withdrawing from the European Union. Japan’s TOPIX8 delivered the best relative returns for the first quarter, even though it returned -17.5%. Economic data releases so far have been negative, with more depressing news expected to come. World equities and Australian equities now account for 19% and 10% respectively in the NAA. Australia has managed to contain the virus without complete lockdown restrictions and appears on track to be one of the first nations to be able to begin the journey back to a more fully functioning economy, which helps support the concentration in domestic equities.
Key Points
The setting of the economic climate involves deciding on where we think the global economy is moving, and then for each country we determine the likely long-term values for inflation, risk free rates, long-term bond yields and earnings growth. By taking current valuations as a starting point, this allows us to determine expected returns for global assets from this point forward.
- Overall, substantial changes to the neutral asset allocation have been made as our economic climate assumptions evolve in response to the ongoing COVID-19 crisis
- We believe these risks will play out more negatively in the period ahead. Financial markets have experienced great distress and it is too early to declare victory over the virus.
- Therefore, we have lowered our inflation assumptions across all markets, along with lower cash rates and long-term yields to reflect the significant action taken by central banks. These emergency settings are expected to remain in place until the lockdown measures and social distancing rules are relaxed.
- Earnings growth will plunge over the coming quarter, with a return to more normalised earnings unlikely to be seen until 2021. In addition to lowering our expected earnings, we have increased the volatility from forward earnings to reflect the divergence in approach that corporations are taking towards providing forward guidance.
- Portfolio positioning has focused on the balance between equities and bonds. With lower equity allocations and therefore, increased exposure to bonds, there are opportunities to increase the diversification within fixed income. Exposure to global bonds, domestic bonds, and credit – both investment grade and high yield – has been increased. The increased allocation to global bonds and credit has seen a removal of the allocation to emerging market bonds.
- We remain cautious on commodities and the Fund currently has no allocation to this asset class.
- While market conditions might appear risky and raise concern, this can also lead to opportunities. The risks the economic climate can present are always dealt with diligently and in line with the Fund’s investment philosophy and process.
- The Fund continues to strive for consistent returns above inflation while aiming to minimise drawdowns and preserve investor capital.
- As a highly experienced team with over two decades’ experience, the Multi-Asset Solutions team will continue to implement the Fund’s established and methodical NAA investment process and then amend positioning through the Dynamic Asset Allocation (DAA) process as opportunities arise.
Credit
The allocation to investment grade and high yield credit has been facilitated by the reduction in equities, while still delivering a lower risk portfolio at the aggregate level. Credit markets recently weathered great turbulence as spreads widened to levels last seen in the GFC. While liquidity had almost disappeared as the COVID-19 crisis surprised markets, support from central banks to improve liquidity has provided optimism – notably corporate bond purchase programs announced by the US Federal Reserve and the European Central Bank. These programs have indicated that they will not only be purchasing government bonds and investment grade credit, but that this will be extended to lower quality, high yield bonds; a first for both central banks. While the prospect of central banks buying bonds is not necessarily a positive sign of the state of economy, we believe this will provide more support for capital markets to continue to function and see the private sector step in and provide the necessary liquidity on the back of central bank support.
Government Bonds
The allocation to Australian government and global bonds has increased as economic uncertainty rises. Although even government bonds were not immune to the unprecedented sell off alongside riskier assets like equities, the traditional relationship between the two asset classes has slightly improved. Much of the forced selling in March occurred as investors rushed to increase their cash levels. While liquidity was temporarily scarce, central bank initiatives to inject capital back into the economy have eased anxieties. Our allocation to Australian government bonds has largely increased, from 21% to 33%, but remains concentrated in shorter maturities. We have also reinstated a neutral allocation to global government bonds (hedged) as yields rise and as we continue to take a defensive stance with the portfolio. Although the cash rate has reached the historical low of 0.25%, the Fund maintains a strategic allocation to cash, which can be deployed when attractive investment opportunities present themselves and ensure an appropriate level of liquidity for any flows.
How do we determine the right mix of NAA (beta) and DAA (alpha)?
Based on our assumptions for the economic climate, and our expected returns, we can determine the likelihood of meeting the portfolio’s investment objective over the investment horizon. It is becoming increasingly likely that relying solely on the NAA in a constrained long only, unlevered environment will not be sufficient to meet the return objectives. This is where we use our DAA process to take into account shorter-term market dynamics which aims to deliver additional returns and abate portfolio risks, such as tail events. By adding an uncorrelated return source (alpha) we can improve the portfolio’s likelihood of meeting the investment objective.
The combination of NAA and DAA requires the consideration of the current allocations; as the extent to which active management may be used is managed through the portfolio’s risk budget to avoid unwanted additional risks. We consider both the tracking error (as well as other risk metrics) and the expected return, in assessing the portfolio’s ability to meet its investment objective. The ability to add scalable alpha to portfolios provides flexibility to deliver on the investment objective; even in a lower return environment.
In this lower return environment, by allowing the blending of alpha and beta strategies to be more dynamic within the framework described above, we still have the potential to deliver on our client’s investment objectives.
In the current low return environment it is critical to have the flexibility to blend beta and alpha to deliver a real return of 4.5% pa above inflation over rolling five year periods before fees and taxes.
We believe our investment process and philosophy provides our clients the highest possibility of obtaining a real return, with the current outlook making our DAA paramount.
The exposure to emerging markets remains at nil weight within the NAA. While political unrest both domestically and globally was high in recent times for this market, the COVID-19 outbreak is expected to have even greater detrimental effects on these regions and the global economy. While the NAA weight remains at nil, we can still take selective exposures to these regions over the coming months through our DAA, if the dynamics improve between now and the next review of our economic climate assumptions.
Due to this reduction in global equity allocations, the exposure to foreign currency also remains low.
1. IHS Markit Services PMI
2. Eurostat
3. Westpac Bank Consumer Sentiment Index
4. Trading Economics
5. We would expect equities to rise over the long term
6. Commonwealth Bank - Global Markets Research
7. IBISWorld
8. Tokyo Stock Price Index
Important Information
This material has been prepared and issued by First Sentier Investors (Australia) IM Ltd (ABN 89 114 194 311, AFSL 289017) (Author). The Author forms part of First Sentier Investors, a global asset management business. First Sentier Investors is ultimately owned by Mitsubishi UFJ Financial Group, Inc (MUFG), a global financial group. A copy of the Financial Services Guide for the Author is available from First Sentier Investors on its website.
This material contains general information only. It is not intended to provide you with financial product advice and does not take into account your objectives, financial situation or needs. Before making an investment decision you should consider, with a financial advisor, whether this information is appropriate in light of your investment needs, objectives and financial situation. Any opinions expressed in this material are the opinions of the Author only and are subject to change without notice. Such opinions are not a recommendation to hold, purchase or sell a particular financial product and may not include all of the information needed to make an investment decision in relation to such a financial product.
To the extent permitted by law, no liability is accepted by MUFG, the Author nor their affiliates for any loss or damage as a result of any reliance on this material. This material contains, or is based upon, information that the Author believes to be accurate and reliable, however neither the Author, MUFG, nor their respective affiliates offer any warranty that it contains no factual errors. No part of this material may be reproduced or transmitted in any form or by any means without the prior written consent of the Author.
 |  |
|---|